


 Apex Code Development
 You need to sign in to do that
Don't have an account?
Superbadge - Reports & Dashboards Specialist - Create sales dashboards in Salesforce Classic
So I am stuck on Challange 2 of the Reporting Superbadge..Have been for the past 2 days and cannot get past. I have attempted to start over but now I am not sure what is wrong with my Closed Opps: number and amount by month Report. I cannot get the chart to be correct. I have attempted to create the Chart on the report and on the dashboard itself but cannot get my Number of Deals formula show as an available option anymore. Can anyone help with this?
Here is the rest of my configuration that I am assuming is incorrect but can't pinpoint how!!!
Here is the rest of my configuration that I am assuming is incorrect but can't pinpoint how!!!
Also - here is how I am trying to edit it on the Dashboard itself, but having the same error.
I figured out my own issue. In order to get the # of Deals (Record Count Formula) to appear as an option in the report chart (Edited from the report) you have to select Line - then check the box. Ill post pictures of the finalized report and chart settings that got me passed this!
Note: I created this report in Salesforce Classic.
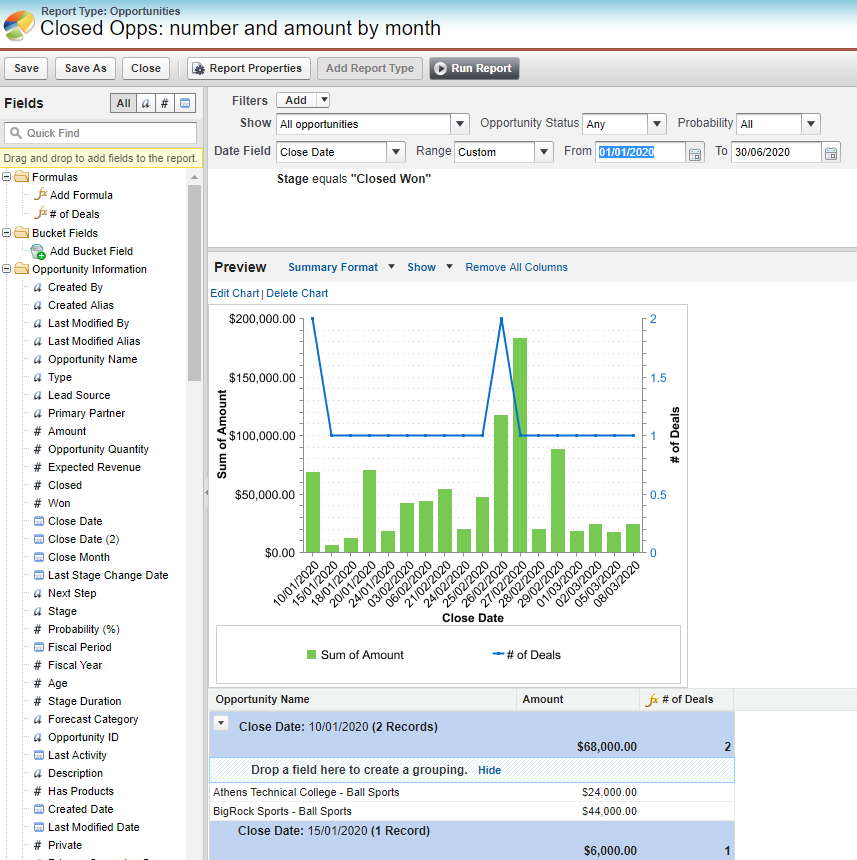
- Report Configuration/Settings:
- Used the Standard Opportunities Report Type
- Report Name - I suggest Copy & Pasting the values
- Closed Opps: number and amount by month
- Report Folder - Make sure to save the Report into a CUSTOM Report Folder 'Executive Reports'
- Show - All opportunities
- Date Field - 'Close Date' with 'Custom' Range of: 01/01/2020 to 06/30/2020
- Add Filter: Stage = "Closed Won"
- Make sure your report is in 'Summary Format'
- Fields to display:
- Opportunity Name
- Amount (Summarized by Sum)
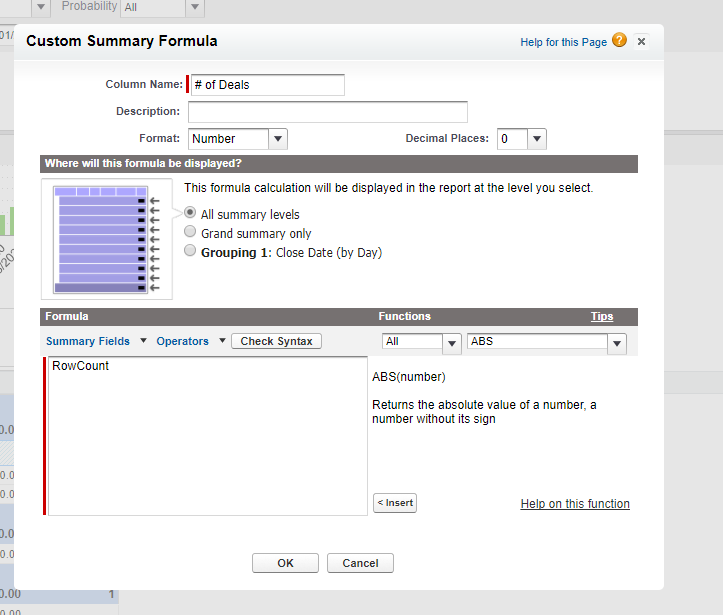
- Formual Field created from report for '# of Deals' (See Picture)
- Column Name: # of Deals
- Format: Number
- Decimal Places: 0
- Grouping: All summary levels
- Formula: RowCount (Click 'Summary Fields' and then select 'Record Count')
- Summarize/Group Report by: Close Date (Mine is Sorted Ascending)
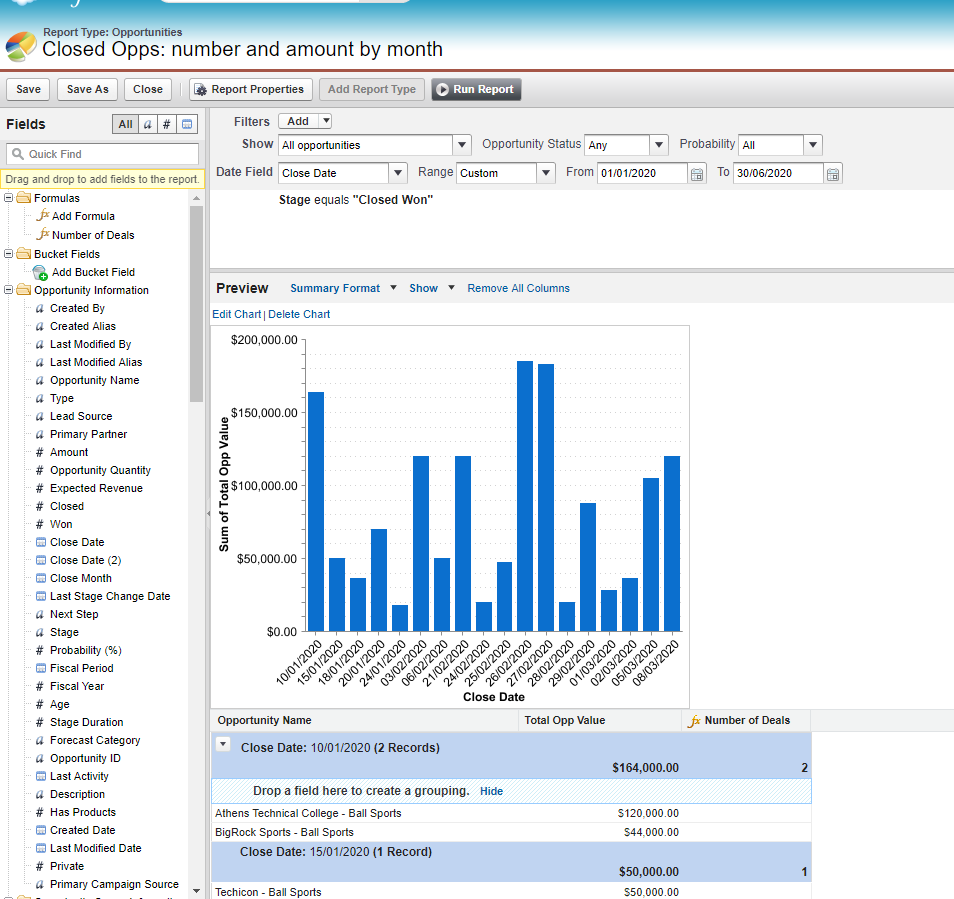
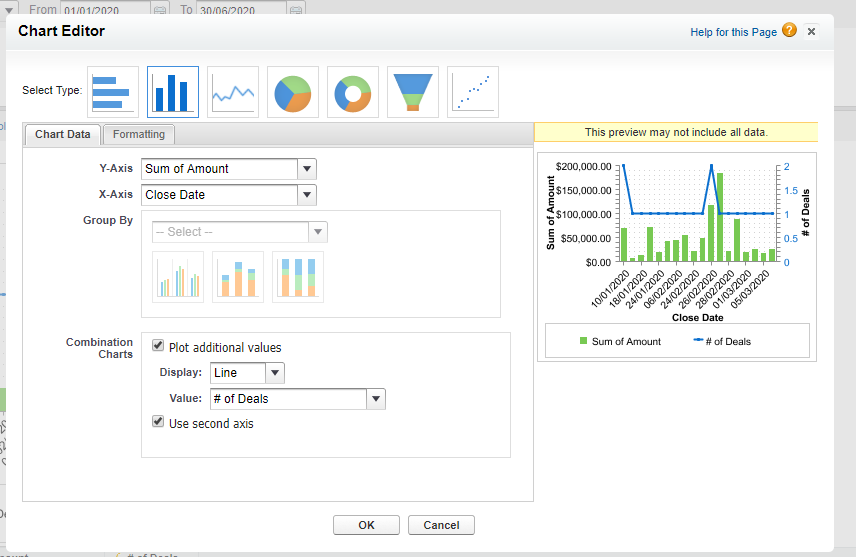
- Report Chart Configuration/Settings:
- Created Chart from Report NOT from Dashboard
- Chart Type: Vertical Bar Chart
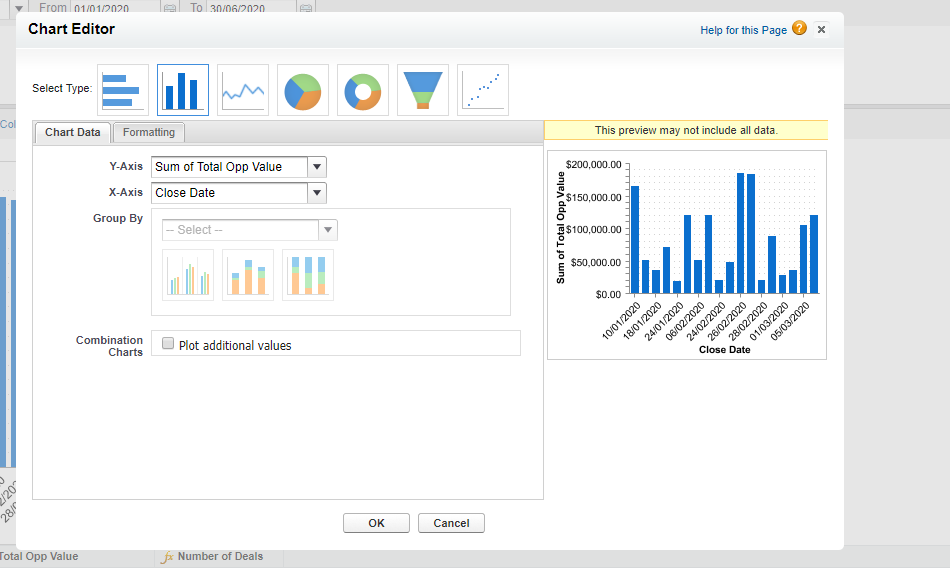
- Chart Data:
- Y-Axis: Sum of Amount (Will only show if your Amount field is summarized correctly in the report.
- X-Axis: Close Date
- Group By: Should be grey'd out and not able to edit.
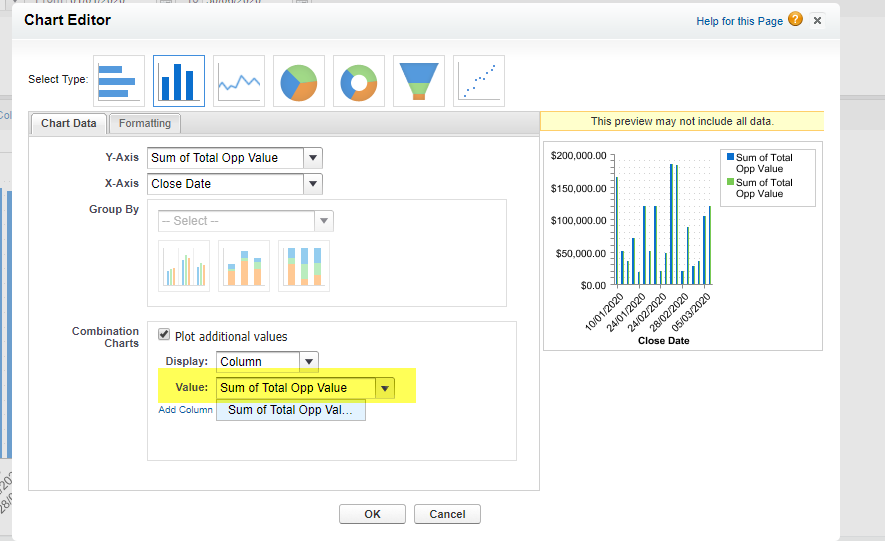
- Combination Charts - Plot additional values: TRUE (CHECK THIS BOX)
- Display: Line
- Use second axis: TRUE (You have to check this box in order to see the '# of Deals' formula you created)
- Value: # of Deals
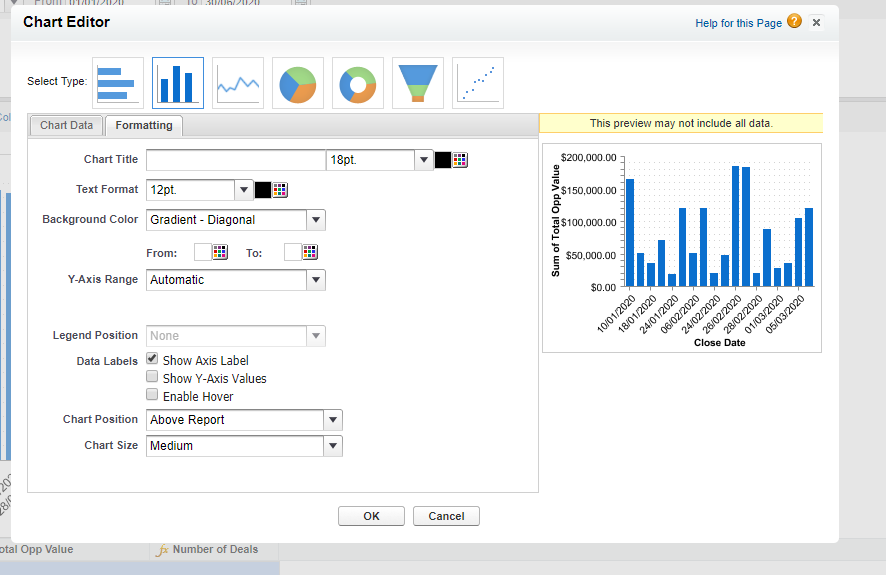
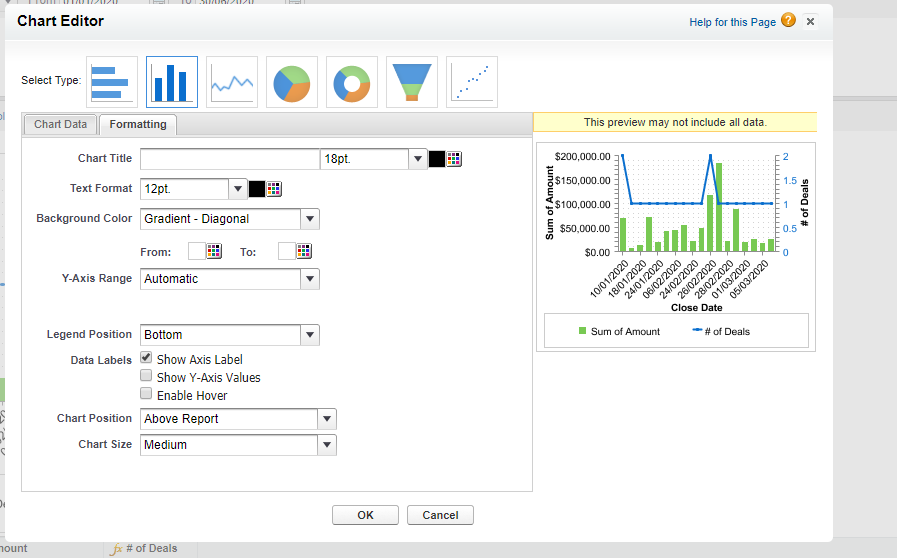
- Formatting:
- I left all settings with the defaulted value EXCEPT:
- Legend Position: Bottom
- I left all settings with the defaulted value EXCEPT:
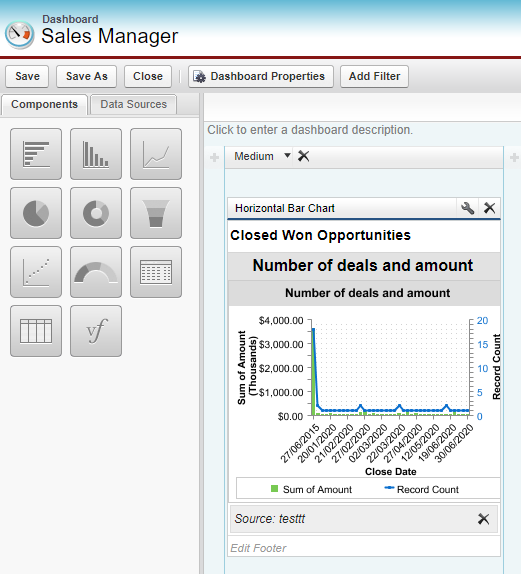
Then on the Dashboard itself here is how I configured the Chart Settings:
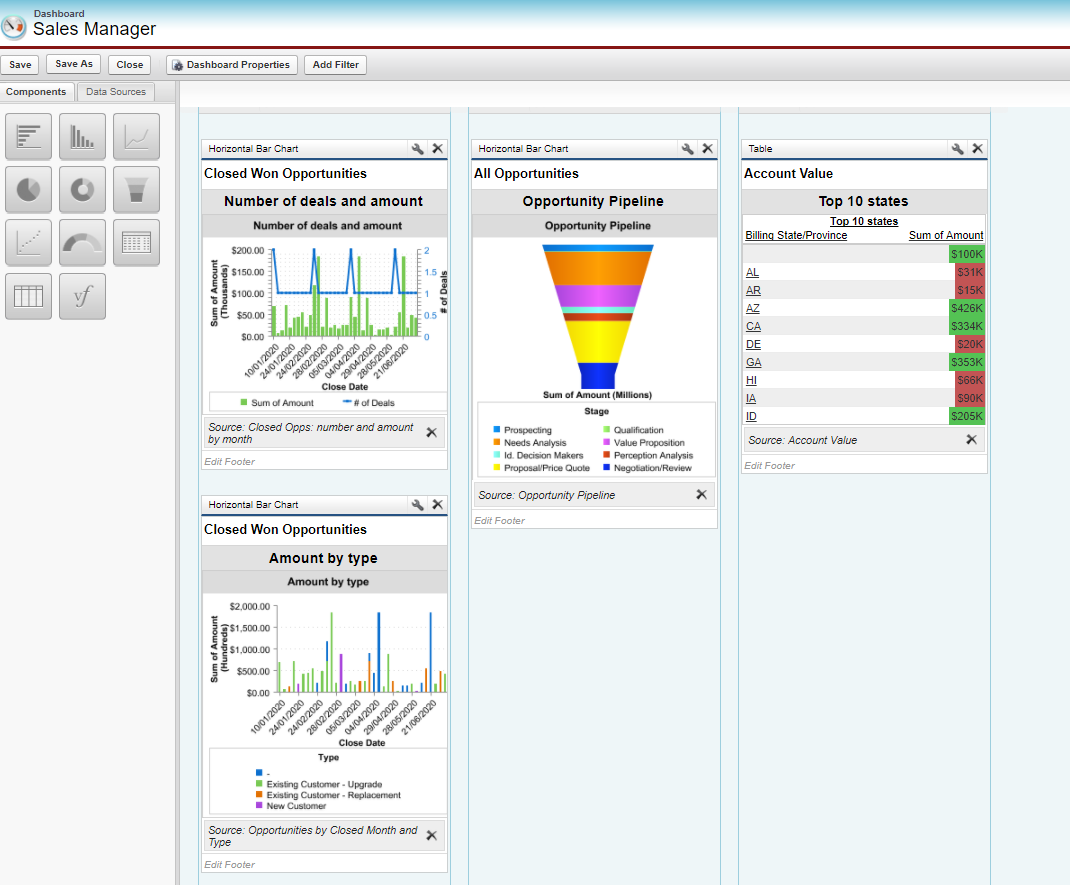
- Components: Horizontal Bar Chart
- Data Sources: Closed Opps: number and amount by month (Report)
- Header: Closed Won Opportunities
- Title: Number of deals and amount
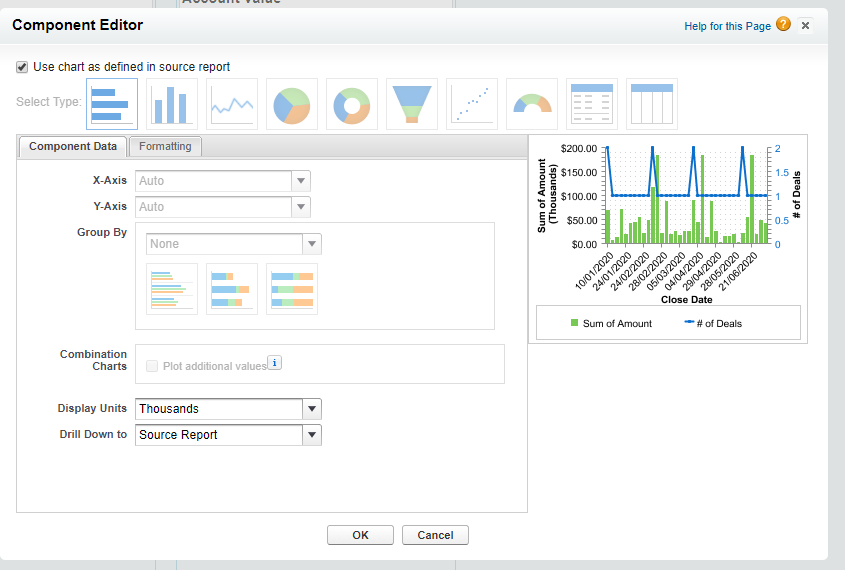
- Chart Settings:
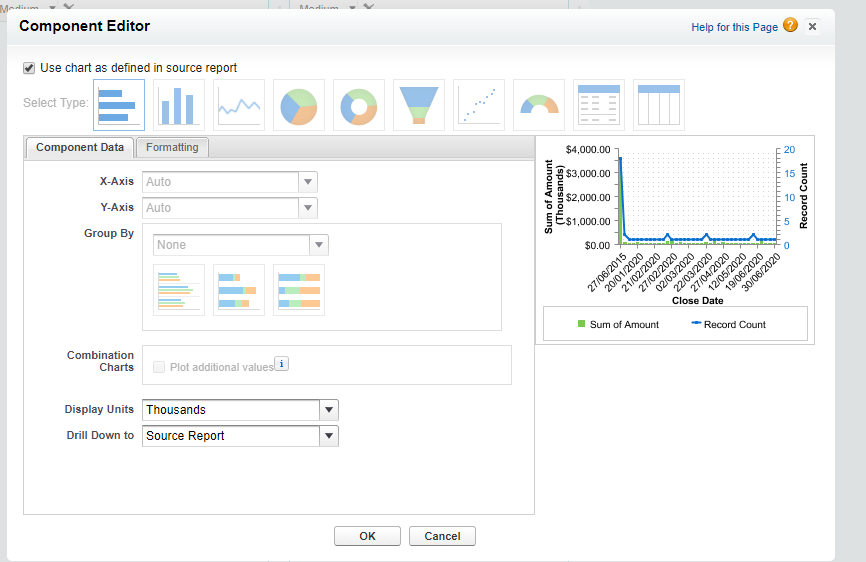
- Use chart as defined in source report = TRUE
- Display Units: Thousands
- Drill Down to: Source Report
Useful thread. You solved my problem. I was looking for it for a long time. I am really thankful to you. https://taknikdrashta.com (https://taknikdrashta.com" target="_blank)