


 Apex Code Development
 You need to sign in to do that
Don't have an account?
SOQL Query not rendering Column Headers
Hello,
Working on creating an aggregated Apex Class with a SOQL query, but before I can build out the class, my soql query isn't producing the column headers, but show up as, Unknown_Field__1 , Unknown_Field__2, Unknown_Field__3.
The values produced are correct though.
When I query this in workbench, I got the results shown below.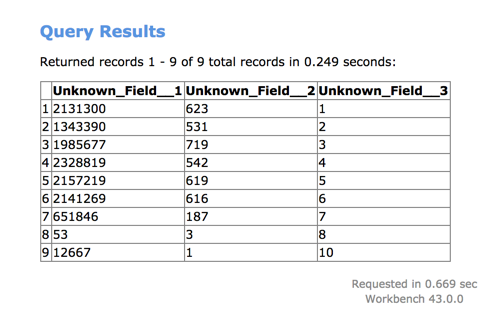
Converted_Monthly_Sqft__c is a number field
If someone can let me know what I'm doing wrong or point me in the right direction, it will be appreciated.
Once this is correct, the SOQL Query will be placed inside my Apex Class:
Working on creating an aggregated Apex Class with a SOQL query, but before I can build out the class, my soql query isn't producing the column headers, but show up as, Unknown_Field__1 , Unknown_Field__2, Unknown_Field__3.
The values produced are correct though.
When I query this in workbench, I got the results shown below.
SELECT
SUM(Converted_Monthly_Sqft__c),
COUNT(Name),
CALENDAR_MONTH(CloseDate) Date_Converted_Month_Year__c
FROM
Opportunity
WHERE stageName = 'Conversion' AND CALENDAR_YEAR(CloseDate) = 2018
GROUP BY CALENDAR_MONTH(CloseDate)
ORDER BY CALENDAR_MONTH(CloseDate)
Converted_Monthly_Sqft__c is a number field
If someone can let me know what I'm doing wrong or point me in the right direction, it will be appreciated.
Once this is correct, the SOQL Query will be placed inside my Apex Class:
public class RealChartController {
    public List<AggregateResult> getData() {
        return
            [SUM(Total_Converted_Volume_Sqft__c) ,
            COUNT(Name) numOppsConversion,
            CALENDAR_MONTH(CloseDate) theMonth
            FROM
            Opportunity
            WHERE stageName = 'Conversion' AND CALENDAR_YEAR(CloseDate) = 2018
            GROUP BY CALENDAR_MONTH(CloseDate)
           ORDER BY CALENDAR_MONTH(CloseDate)];
    }
}
Please make below change ...
Change SOQL where conditions and other aggregate values ..
Make Sure your aggregate value alias names are matched to the barseries and lineseries xAxis and yAsix fields ..
public class RealChartController {
    public List<AggregateResult> getData() {
        return
            [SELECT SUM(Amount) amt, COUNT(Name) numOppsConversion,
             CALENDAR_MONTH(CloseDate) theMonth
             FROM Opportunity
             WHERE stageName != 'Closed Won' AND CALENDAR_YEAR(CloseDate) != 2011
             GROUP BY CALENDAR_MONTH(CloseDate)
             ORDER BY CALENDAR_MONTH(CloseDate)];
    }


}
<apex:page controller="RealChartController" showHeader="false" readOnly="true"> <apex:chart width="100%" height="300" data="{!data}"> <apex:axis type="Numeric" position="left" fields="amt" title="Opportunities Sqft" grid="true"/> <apex:axis type="Numeric" position="right" fields="numOppsConversion" title="Number of Opportunities"/> <apex:axis type="Category" position="bottom" fields="theMonth" title="Month"> </apex:axis> <apex:barSeries title="Monthly Sales" orientation="vertical" axis="right" xField="theMonth" yField="amt"/> <apex:lineSeries title="Closed-Won" axis="left" xField="theMonth" yField="numOppsConversion" markerType="circle" markerSize="4" markerFill="#00FF00"/> </apex:chart> </apex:page>All Answers
public class RealChartController { public List<ChartWrapper> getData() { List<AggregateResult> ggs = [Select SUM(Amount) amt, COUNT(Name) numOppsConversion, CALENDAR_MONTH(CloseDate) theMonth FROM Opportunity WHERE stageName != 'Conversion' AND CALENDAR_YEAR(CloseDate) != 2018 GROUP BY CALENDAR_MONTH(CloseDate) ORDER BY CALENDAR_MONTH(CloseDate)]; List<ChartWrapper> wrapper = new List<ChartWrapper>() ; wrapper.add(new ChartWrapper('Header' ,'Header','Header' )); for(AggregateResult r :ggs){ wrapper.add(new ChartWrapper((String)r.get('expr0') ,(String)r.get('expr1'), (String)r.get('expr2'))); } return wrapper ; } public class ChartWrapper { public String amt {get;set;} public String numOppsConversion {get;set;} public String theMonth {get;set;} public ChartWrapper(String amt, String numOppsConversion , String theMonth){ this.amt = amt ; this.numOppsConversion = numOppsConversion ; this.theMonth = theMonth ; } } }Are there values I need to input for 'expr0', 'expr1', 'expr2'?
Also, trying to get the values for conversions in 2018 and noticed that != is in the syntax.
Please let me know.
Thank you!
Disregard 'expr0' comment in previous post.
Here is my VF page:
<apex:page controller="RealChartController" showHeader="true" readOnly="true">
    <apex:chart width="100%" height="300" data="{!data}">
        <apex:axis type="Numeric" position="left" fields="amt"
            title="Opportunities Sqft" grid="true"/>

        <apex:axis type="Numeric" position="right" fields="numOppsConversion"
            title="Number of Opportunities"/>

        <apex:axis type="Category" position="bottom" fields="theMonth"
            title="Month">

        </apex:axis>
        <apex:barSeries title="Monthly Sales" orientation="vertical"
            axis="right" xField="theMonth" yField="amt"/>
        <apex:lineSeries title="Closed-Won"
            axis="left" xField="theMonth" yField="numOppsConversion"
            markerType="circle" markerSize="4" markerFill="#00FF00"/>
    </apex:chart>
</apex:page>
I got it to render, but my mapping may not be correct in VF, can you take a look?
Coming into the exp0 that how aggregate function result will be
Please make below change ...
Change SOQL where conditions and other aggregate values ..
Make Sure your aggregate value alias names are matched to the barseries and lineseries xAxis and yAsix fields ..
public class RealChartController {
    public List<AggregateResult> getData() {
        return
            [SELECT SUM(Amount) amt, COUNT(Name) numOppsConversion,
             CALENDAR_MONTH(CloseDate) theMonth
             FROM Opportunity
             WHERE stageName != 'Closed Won' AND CALENDAR_YEAR(CloseDate) != 2011
             GROUP BY CALENDAR_MONTH(CloseDate)
             ORDER BY CALENDAR_MONTH(CloseDate)];
    }


}
<apex:page controller="RealChartController" showHeader="false" readOnly="true"> <apex:chart width="100%" height="300" data="{!data}"> <apex:axis type="Numeric" position="left" fields="amt" title="Opportunities Sqft" grid="true"/> <apex:axis type="Numeric" position="right" fields="numOppsConversion" title="Number of Opportunities"/> <apex:axis type="Category" position="bottom" fields="theMonth" title="Month"> </apex:axis> <apex:barSeries title="Monthly Sales" orientation="vertical" axis="right" xField="theMonth" yField="amt"/> <apex:lineSeries title="Closed-Won" axis="left" xField="theMonth" yField="numOppsConversion" markerType="circle" markerSize="4" markerFill="#00FF00"/> </apex:chart> </apex:page>