


 Apex Code Development
 You need to sign in to do that
Don't have an account?
lighning experience reports and dashboards specialist error CGWWGKMQ
I'm working on the Trailhead Lighning Experince Reports and Dashboards Spcialist superbadge. I've made it to step 7 and now I get this message:
Challenge Not yet complete... here's what's wrong:
There was an unexpected error while verifying this challenge. Usually this is due to some pre-existing configuration or code in the challenge Org. We recommend using a new Developer Edition (DE) to check this challenge. If you're using a new DE and seeing this error, please post to the developer forums and reference error id: CGWWGKMQ
I hate to start over. The dashboard is built and functional.
Ideas other than a new DE and start from the beginning?
I've tried refreshing with no success.
I've renamed the dashboard and built it fresh from the ground up.
I've now passed the challenge.
Thanks for the suggestion, but seems something was very wrong with the dashboard.
John.
All Answers
I would suggest you refresh the dashboard before checking the challenge, which worked for me.
Please mark it as solved if my reply was helpful. It will make it available for other as the proper solution.
Best Regards
Sandhya
I've tried refreshing with no success.
I've renamed the dashboard and built it fresh from the ground up.
I've now passed the challenge.
Thanks for the suggestion, but seems something was very wrong with the dashboard.
John.
Think Matrix Report. The clue "organize data horizontally and vertically" is pointing you towards a report that groups rows and columns.
Hope this helps.
John.
Thanks for the hint. Still can't crack the code. Now I am getting a different error.
Thanks again!
John
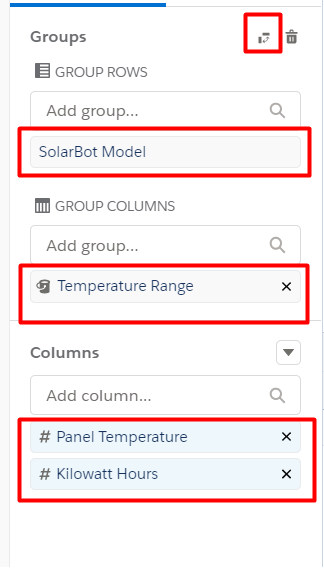
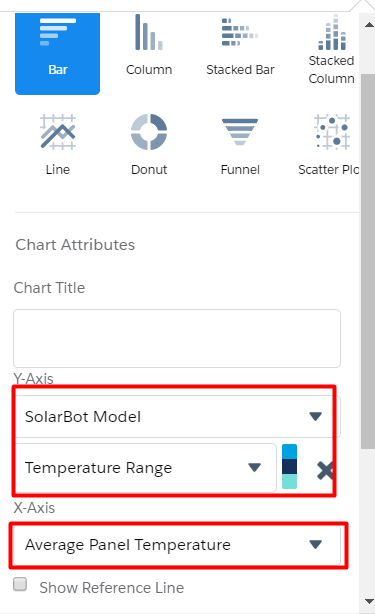
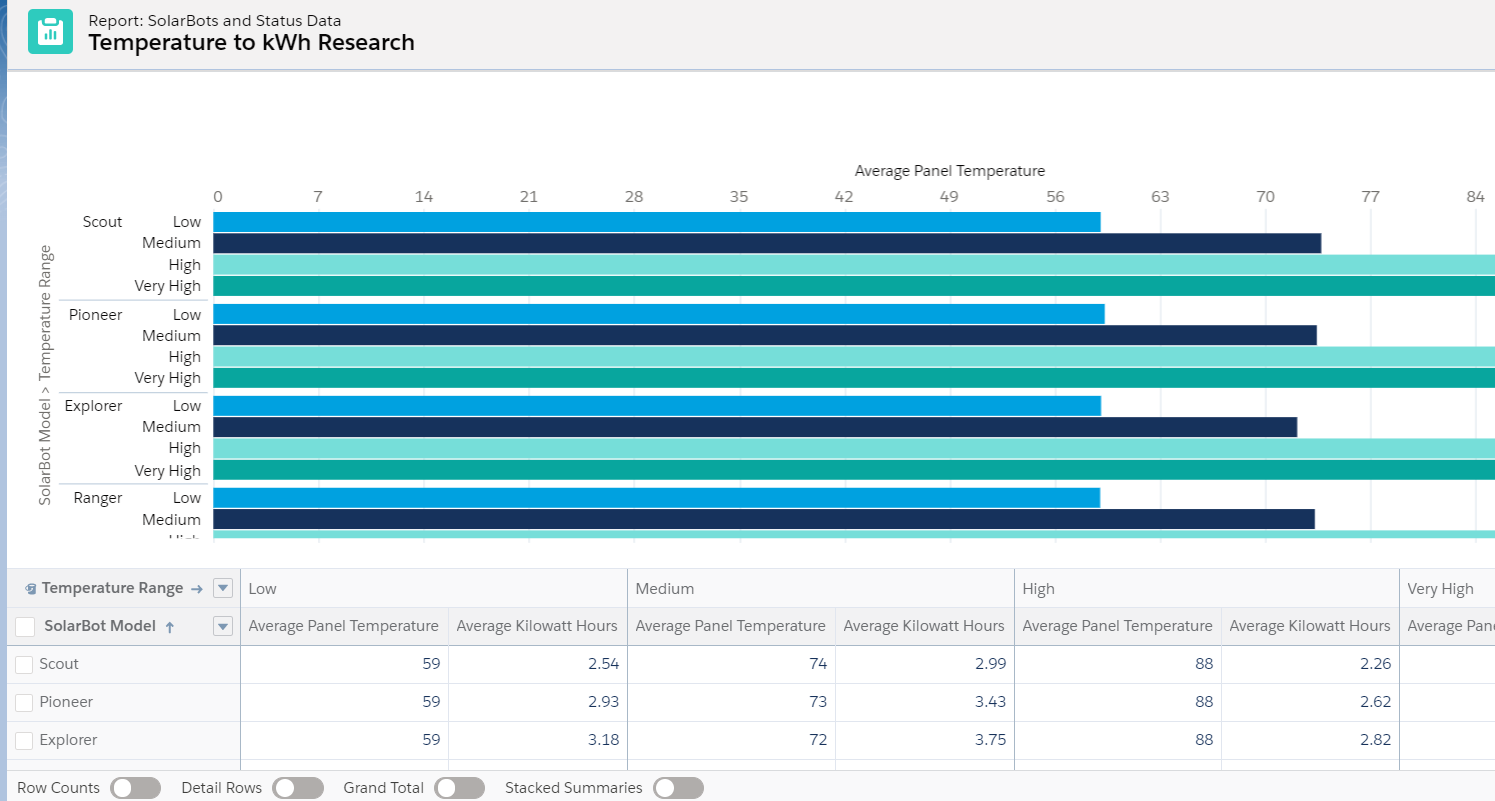
1. Add an additional field/column called 'SolarBot Model'
2. SolarBot Model-> Group Columns by this field
3. Uncheck 'Stacked Summaries' at the bottom of the page
4. Add a bar chart and it should look like the examples shown in the above posts
Still i am facing the issue in this challenge though i have created as you said can you please help me solving this challenge
H! @Praveenkumar maradabudi 7
That was like this:
And job has done :)