


 Apex Code Development
 You need to sign in to do that
Don't have an account?
The 'Sales Pipeline Overview' lens does not appear to have the correct query.
I'm getting this error on Wave Desktop Exploration: Analyze Your Data Over Time.
Challenge Not yet complete... here's what's wrong:
The 'Sales Pipeline Overview' lens does not appear to have the correct query. Please check the requirements and ensure everything is setup correctly.
I've redone the lens several times and checked that I am evaluating on the correct Dev Org.
Any help?
I am having the same issue. If you have already solved the issue or come across any help, please let me know.
Cheers, Faruk
error: Challenge Not yet complete... here's what's wrong:
The 'Sales Pipeline Overview' lens does not appear to have the correct query. Please check the requirements and ensure everything is setup correctly.
here is an image of the app:
here is the cretia for the challenge:
Create a lens that shows your sales forecast for the next month
Your team's doing great, but how does next month look? Build a lens to look at product sales pipeline. Explore the DTC Opportunity dataset, group by close date, then group by forecast category. Note that grouping order matters! Measure the sum of quantity (#). Show only open opportunities. Change the chart type to Timeline, then save the lens as "Sales Pipeline Overview" in the My Exploration app you created earlier.
Dataset: DTC Opportunity
Add Group: Close Date (Year-Month)
Add Group: Forecast Category
Change Measure: Count of Rows to Sum of #
Filter by: Closed Equals False
Chart Type: Timeline
Lens Name: Sales Pipeline Overview
App: My Exploration
Any help would be great or point out where i went wrong. thks!
I have found another issue for Shield Platform Encryption trailhead.
Issue is: Classic Encryption works perfectly for Custom fields but platform encryption for Standard objects (i.e. Account. Phone) doesn't work. I have raised the issue/question on "https://developer.salesforce.com/forums/ForumsMain?id=906F0000000kHdb"
No one from Salesforce has adressed this issue. Therefore, seeking for your help in resolving this issue.
Cheers, Faruk
"Challenge Not yet complete... here's what's wrong:
The 'Sales Pipeline Overview' lens does not appear to have the correct query. Please check the requirements and ensure everything is setup correctly."
Dataset: DTC Opportunity (Done)
Add Group: Close Date (Year-Month) (Done)
Add Group: Forecast Category (Done)
Change Measure: Count of Rows to Sum of # (Only show Sum of Amout as option)
Filter by: Closed Equals False (Done)
Chart Type: Timeline (Done)
Lens Name: Sales Pipeline Overview (Done)
App: My Exploration (Done)
Any help would be great or point out where I went wrong..
Thanks
The 'Sales Pipeline Overview' lens does not appear to have the correct query. Please check the requirements and ensure everything is setup correctly. I am also facing the same issue. I logged a new wave de org yesterday. Is there a workaround?
I went to that section .. reverified hands-on challenge. Below is the results. I had simlar problem and it was suggested that I obtain a new DE-WAVE id and restart exercise.. The couse changed over the last month or so which resulted in errors for people who had id's created prior to this chnage.
Just to be be safe, This is the challenge an results of challenge from my id.
When did you get your id? (MM/DD/YY)?
I am having same issue. I created my wave account last week. I also having trouble finding the "My Exploration". I am not sure what to do with this. Any help will be greatly apperciated .
"Challenge Not yet complete... here's what's wrong:
The 'Sales Pipeline Overview' lens does not appear to have the correct query. Please check the requirements and ensure everything is setup correctly."
"Challenge Not yet complete... here's what's wrong:
The 'Sales Pipeline Overview' lens does not appear to have the correct query. Please check the requirements and ensure everything is setup correctly."
Not sure what i am doing wrong?
Thanks,
Any ideas?
The previous challenge to this one also is failing. Looks like the trailhead is set for the old UI as some of the directions are not quite the same in this org (e.g. sorting desc on the measures) @pchoi any thoughts on how to validate the challenge?
I deleted the "Sales Pipeline Overview" lens and recreated it. I still get the same error.
https://developer.salesforce.com/promotions/orgs/wave-de/
Instructions on the module are a little bit different, not much, just a couple of things, such sorting the values in descending order, which is instructed to click on a gear icon on the group, but in the org you have to click on the measure (and a couple more that I don't remember). Still having the same challenge validation problem though :-)
I cannot pass this challenge:
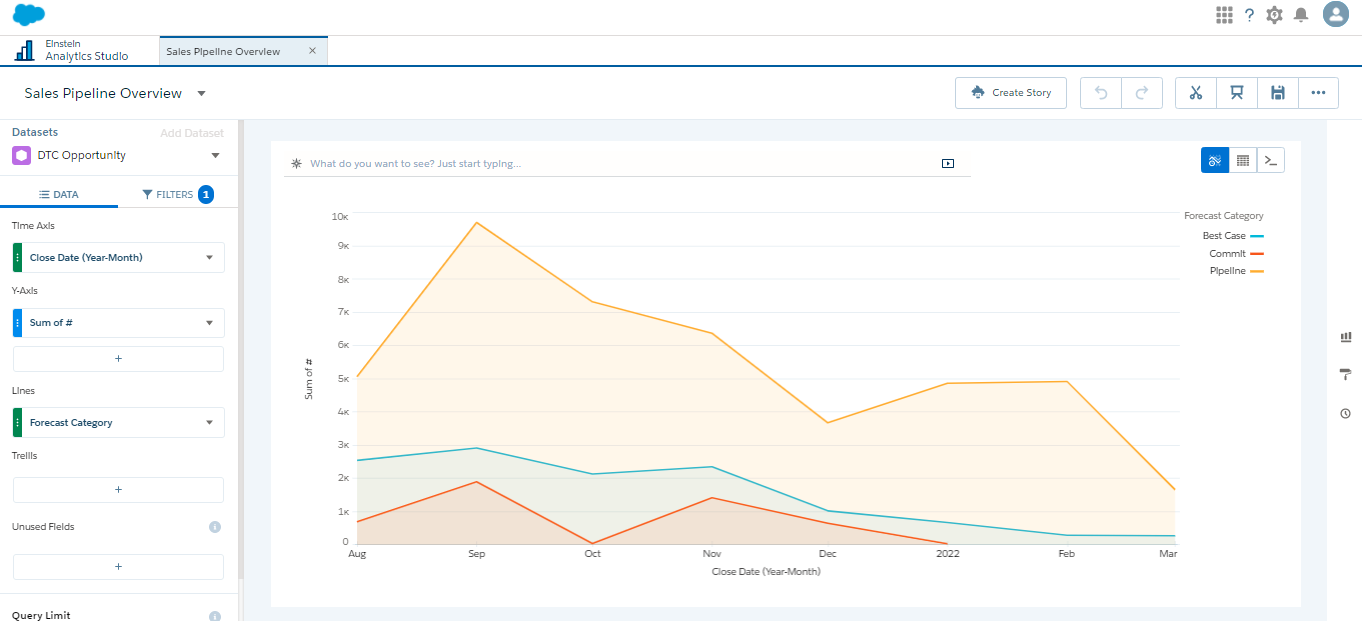
My lens looks like this:
I do not speak English, I apologize if my comments are incoherent
Try to perform the previous challenge, however I had an error. And now in this challenge "Create a lens that shows your sales forecast for the next month" I encounter this situation, I do not know if it is a problem of Trailhead or it is some error in my profile.
Does anyone have any solutions?
Thank you!!
Both "Become a Data Explorer" and "Analyze Your Data Over Time" challenges seem to be unavailable :/
Thanks in advance!
Once again, we're really sorry for the trouble. I know you all worked really hard for your badges and our errors blocked you from getting them. Appreciate the patience and determination. Please continue to raise issues if you have problems with challenges. Thanks!
However, am facing an error while trying to pass the challenge for the module "Analyze Your Data Over Time". Please note that I had created the Wave dev org on 08/24/17.
Here is the screenshot of the error,
And this is my completed challenge,
Any help here is appreciated, Thanks!
Does someone fix the issue? I was reading the comments and I couldn't fix my issue.
Excuse me for the question, but some of you are talking about change or get a new DE-WAVE id.
To be honest, I don't know how I can do that.
Can anyone help me to pass this challenge?
please, help!
same issue here with challenge not yet completed
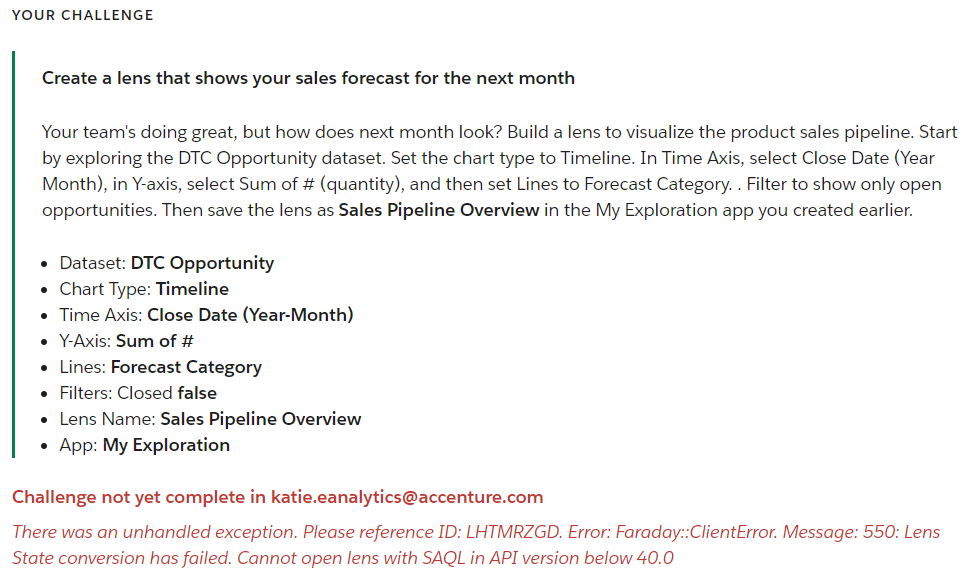
- error : 550: lens state conversion has failed using converter insights.api.converters.dashboardstate_v41ro_v42r0. Cannot open lens with new Wave Charts in API version below 40.0
any help would be appreciated.
I have not finished.
I do not know where wrong.
I'm bad at English.
Sorry for the poor English.
i have signed up for the wave edition like last month, i tried to do the exercise for unit : Desktop Analytics Exploration--Become the data explorer
You're concerned about laptop sales and want to see which industry is bringing in the most revenue. Start by exploring the DTC Opportunity dataset, and change the chart type to Stacked Bar. Now set up your chart. Group your data so there's a bar for each Industry, then add another grouping so there's a bar segment for each Product Name. Change the measure so that the bar length represents the Sum of Amount, and then sort from high to low. Filter to show only won opportunities for the Laptop product family. Then save the lens as Top Laptop Industry in the My Exploration app you created earlier. To ensure that your lens passes the challenge, complete the requirements in exact order.
Dataset: DTC Opportunity
Chart Type: Stacked Bar
Bars: Industry
Bar Segments: Product Name
Bar Length: Sum of Amount
Sort: Descending
Filters: Product Family Laptops
Filters: Won true
Lens Name: Top Laptop Industry
App: My Exploration
i am still receiving below error
The 'Top Laptop Industry' lens does not appear to have the correct query. Please check the requirements and ensure everything is setup correctly.
Please find the below screenshot
Thanks,
Bhushan
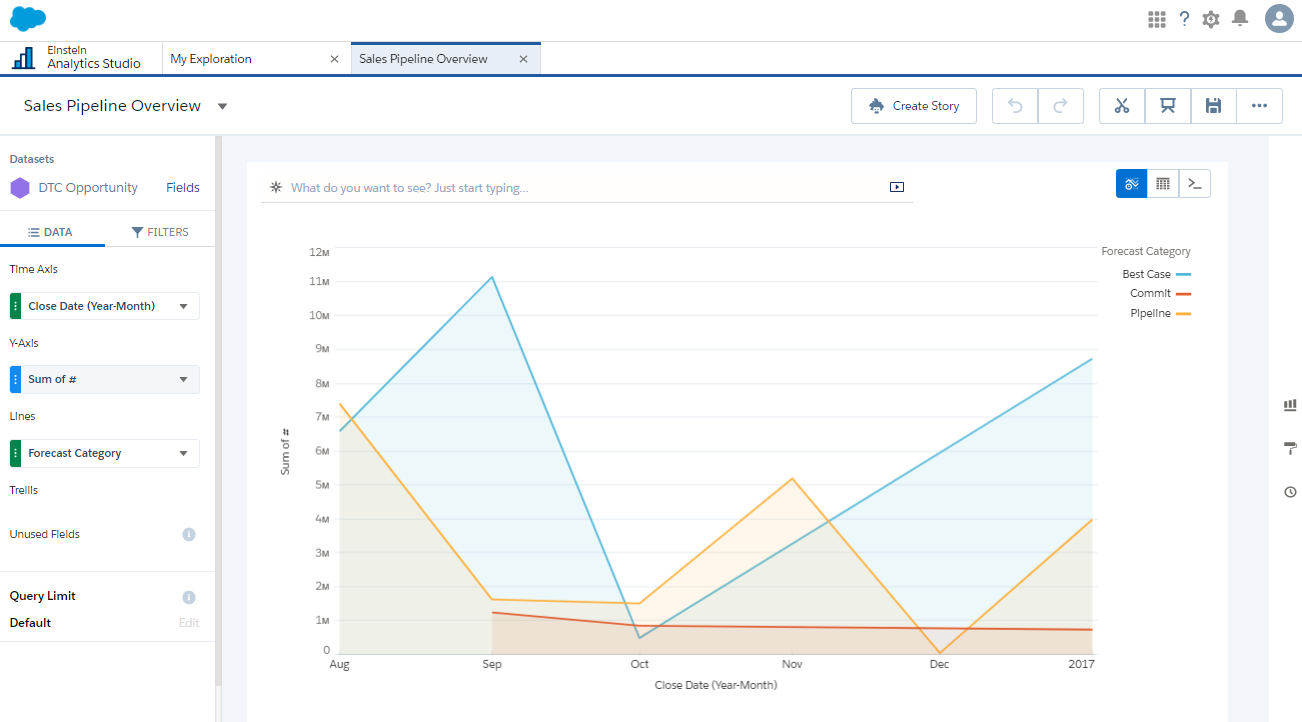
Create a lens that shows your sales forecast for the next month
Your team's doing great, but how does next month look? Build a lens to visualize the product sales pipeline. Start by exploring the DTC Opportunity dataset. Under Bars, group by Close Date, and then group by Forecast Category. Change the measure from Count of Rows to Sum of # (quantity). Filter to show only open opportunities. Change the chart type to Timeline, and note that Forecast Category is now represented as bar segments. Then save the lens as Sales Pipeline Overview in the My Exploration app you created earlier.
Dataset: DTC Opportunity
Bars: Close Date (Year-Month)
Bar Segments: Forecast Category
Bar Length: Sum of #
Filters: Closed false
Chart Type: Timeline
Lens Name: Sales Pipeline Overview
App: My Exploration
Challenge not yet complete in frank.moore@analytics.com
The 'Sales Pipeline Overview' lens does not appear to have the correct query. Please check the requirements and ensure everything is setup correctly.
It is working for me now, what you have to do::
>> Go to Analytics Homepage--> Lenses tab --> Delete all 'Sales Pipeline Overview' already there.
>> Click on Dataset: DTC Opportunity
>> Bars: Close Date (Year-Month)
>> Select stacked bar after that you can see bar segment on the left side.
>> Select Bar Segments: Forecast Category
>>Bar Length: Sum of #
>> Filters: Closed false
>>Chart Type: Timeline
>>Lens Name: Sales Pipeline Overview
>>App: My Exploration
Do things step by step and then check.
The 'Sales Pipeline Overview' lens does not appear to have the correct query. Please check the requirements and ensure everything is setup correctly.
I followed your steps. I am still having same problem.
can someone help?
What issue you are facing, can you post the error to me?
Error:The 'Sales Pipeline Overview' lens does not appear to have the correct query. Please check the requirements and ensure everything is setup correctly.
Help, anyone?
Please let me know incase we are missing something from our end.
Same issue here, unable to move forward... can someone help please
The 'Sales Pipeline Overview' lens does not appear to have the correct query. Please check the requirements and ensure everything is setup correctly.
.
Thanks
Durga
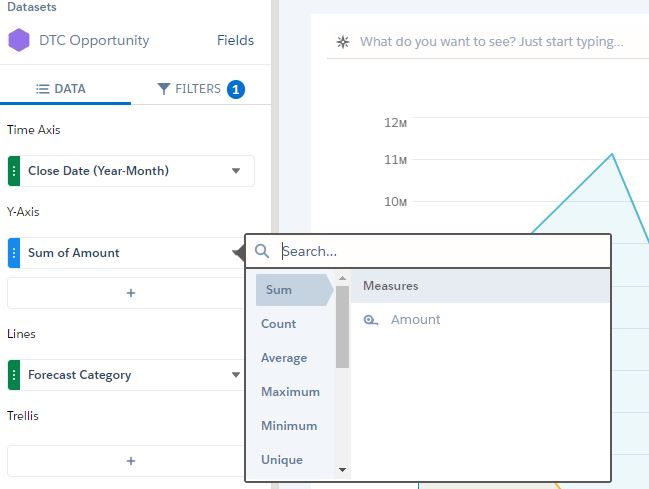
I do not see sum of # as an option my org, what do i do?
Regards,
Rashmi
I am getting same error still. I did login in 2 AI org but getting same error.
Challenge not yet complete in
The 'Sales Pipeline Overview' lens does not appear to have the correct query. Please check the requirements and ensure everything is setup correctly.
Please suggest what is wrong in below lens?
@pchoi, issue is still there and it looks like no way to access superbadge challenge unless its resolved. I completed the challenge with older edition that was just fine for other challenges:
1. Y-Axis condition cannot be set as Sum of # while only Sum of Amount is available. With condition Sum of Amount (not really sure if that`s the issue, Number format is chosen though) - the error is same as for the others: "The 'Sales Pipeline Overview' lens does not appear to have the correct query. Please check the requirements and ensure everything is setup correctly."
2. I did the update in SAQL to look exactly as per challenge criteria and here is the result:
3. Also I tried brand new edition - all created from scratch, Sum of # is still not available, so used Sum of Amount and again the same error pops up: "The 'Sales Pipeline Overview' lens does not appear to have the correct query. Please check the requirements and ensure everything is setup correctly."
Please suggest if there is any workaround.
Thanks,
Katy
Finally I have resolved this issue. please register new user account/org using below link. And Link you trailhead with new account and run same stpes. You will complete this badge.
https://developer.salesforce.com/promotions/orgs/analytics-de
it worked! thanks a lot for resolving this!
When you add the Y-axis (Sum of #), instead of # you will See Column1. Before take all steps above I checked the JSON for the Lens and Column1 seems to be the "Developer" name and # the label. Once you have Column1 instead of # in the UI it seems to work. The issue will be due to the code that runs a check on your work. The code is looking for Column1 and not #. If it finds # it thinks the query is wrong.
Maybe check this part of the JSON
"columnMap": {
"trellis": [],
"plots": [
"sum_Column1"
],
"split": [
"Forecast_Category"
],
"timeAxis": [
"Close_Date_Year~~~Close_Date_Month"
]
If you don't have sum_Column1 then maybe that is the issue
I can not overcome the challenge.
I get the following error:
There was an unhandled exception. Please reference ID: IDNCUYZW. Error: Restforce::ResponseError. Message: 550: Lens State conversion has failed. Cannot open lens with new Wave Charts in API version below 40.0
This is my query:
q = load "DTC_Opportunity_SAMPLE";
q = filter q by 'Closed' == "false";
q = group q by ('Close_Date_Year', 'Close_Date_Month', 'Forecast_Category');
q = foreach q generate 'Close_Date_Year' + "~~~" + 'Close_Date_Month' as 'Close_Date_Year~~~Close_Date_Month', 'Forecast_Category' as 'Forecast_Category', sum('Column1') as 'sum_Column1';
q = order q by ('Close_Date_Year~~~Close_Date_Month' asc, 'Forecast_Category' asc);
q = limit q 2000;
Saludos.
George Aquiño
Good Morning, Did anyone try this challenge? I have the same error as George:
There was an unhandled exception. Please reference ID: JDLDVRRV. Error: Restforce::ResponseError. Message: 550: Lens State conversion has failed. Cannot open lens with new Wave Charts in API version below 40.0
Below is the query result:
q = load "DTC_Opportunity_SAMPLE";
q = filter q by 'Closed' == "false";
q = group q by ('Close_Date_Year', 'Close_Date_Month', 'Forecast_Category');
q = foreach q generate 'Close_Date_Year' + "~~~" + 'Close_Date_Month' as 'Close_Date_Year~~~Close_Date_Month', 'Forecast_Category' as 'Forecast_Category', sum('Column1') as 'sum_Column1';
q = order q by ('Close_Date_Year~~~Close_Date_Month' asc, 'Forecast_Category' asc);
q = limit q 2000;
Is it resolved .. i still face the same issue.
No Solution found
ERROR: The 'Sales Pipeline Overview' lens does not appear to have the correct query. Please check the requirements and ensure everything is setup correctly.
Chalenge:Create a lens that shows your sales forecast for the next month
Your team's doing great, but how does next month look? Build a lens to visualize the product sales pipeline. Start by exploring the DTC Opportunity dataset. Set the chart type to Timeline. In Time Axis, select Close Date (Year Month), in Y-axis, select Sum of # (quantity), and then set Lines to Forecast Category. . Filter to show only open opportunities. Then save the lens as Sales Pipeline Overview in the My Exploration app you created earlier.
Dataset: DTC Opportunity
Chart Type: Timeline
Time Axis: Close Date (Year-Month)
Y-Axis: Sum of #
Lines: Forecast Category
Filters: Closed false
Lens Name: Sales Pipeline Overview
App: My Exploration
Please help !!!!
I was having the same error as the main thread report and what I realize is whenever we are configuring Y-Axis (Sum of #) the field definition on my dataset was being called Collumn9 as per the following screenshot:
This was generating a query such as this one:
q = load "DTC_Opportunity_SAMPLE";
q = filter q by 'Closed' == "false";
q = group q by ('Close_Date_Year', 'Close_Date_Month', 'Forecast_Category');
q = foreach q generate 'Close_Date_Year' + "~~~" + 'Close_Date_Month' as 'Close_Date_Year~~~Close_Date_Month', 'Forecast_Category' as 'Forecast_Category', sum('Column9') as 'sum_Column9';
q = order q by ('Close_Date_Year~~~Close_Date_Month' asc, 'Forecast_Category' asc);
q = limit q 2000;
It's no useful to change the query manually, because if you do so, even resulting in a valid Lens, the challenge will not validate with another error.To overcome the problem I restored the dataset and recreated the lens. To restore the dataset, go to Analytics Studio Home, Find the dataset but do not click on it (otherwise it will open a new lens), instead click in the arrow -> Edit, an click in the restore icon:
A restauration job will start which you can monitor looking on Data Manager. Afterwards, delete the old lens and recreate it. Now you will see the field named as per the expected validation:
Which will result on the following valid and expected query:
q = load "DTC_Opportunity_SAMPLE";
q = filter q by 'Closed' == "false";
q = group q by ('Close_Date_Year', 'Close_Date_Month', 'Forecast_Category');
q = foreach q generate 'Close_Date_Year' + "~~~" + 'Close_Date_Month' as 'Close_Date_Year~~~Close_Date_Month', 'Forecast_Category' as 'Forecast_Category', sum('Column1') as 'sum_Column1';
q = order q by ('Close_Date_Year~~~Close_Date_Month' asc, 'Forecast_Category' asc);
q = limit q 2000;
Two hours lost :facepalm
I followed your solution. My query has been changed but still getting the same error. I have deleted all the previous lenses as well. Kindly help.
Same issue here. Still getting the error after restoring the dataset and recreate the lens.
Appreciate if you can help
My query is as follows;
q = load "DTC_Opportunity_SAMPLE";
q = filter q by 'Closed' == "false";
q = group q by ('Close_Date_Year', 'Close_Date_Month', 'Forecast_Category');
q = foreach q generate 'Close_Date_Year' + "~~~" + 'Close_Date_Month' as 'Close_Date_Year~~~Close_Date_Month', 'Forecast_Category' as 'Forecast_Category', sum('Column1') as 'sum_Column1';
q = order q by ('Close_Date_Year~~~Close_Date_Month' asc, 'Forecast_Category' asc);
q = limit q 2000;
If anyone has any direction please reach out, many thanks.
@Tiago Nascimento
Thank you! Worked for me (Y)