


 Apex Code Development
 You need to sign in to do that
Don't have an account?
Dashboard and Lens variance in WAVE Analytics.
Hi Friends,
I have got a problem with my dashboard which I have been working on. Would be thankful if some one helps me. The lens when clipped and used in the dashboard is not looking like how it is supposed to look. Below are the details.
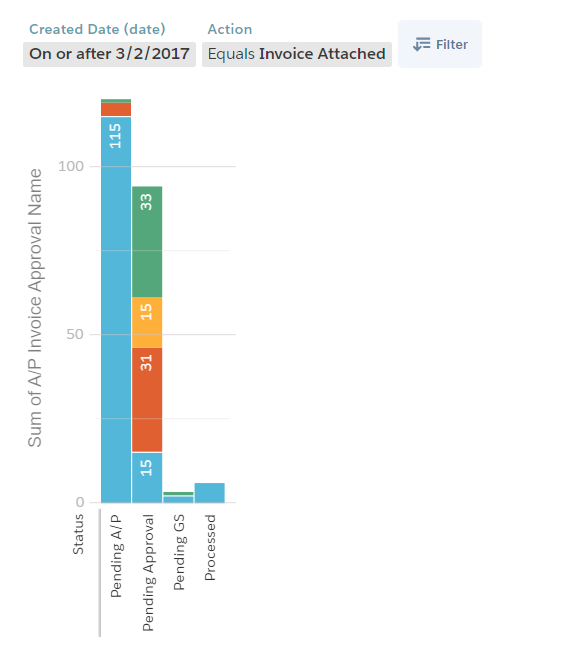
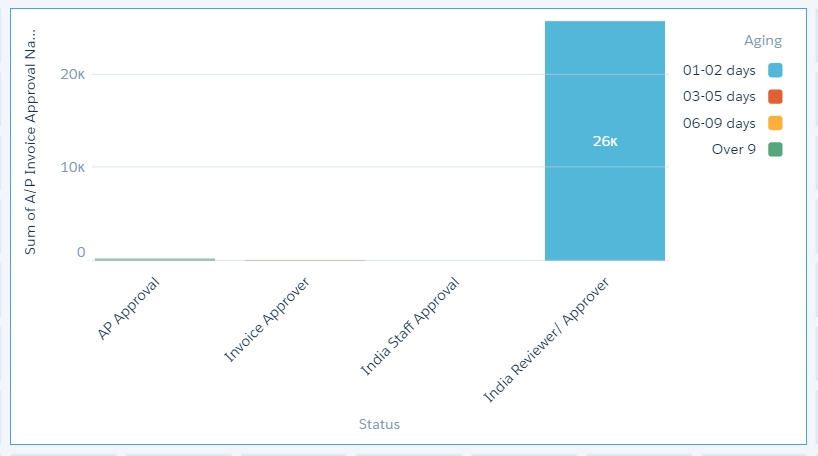
But when it is clipped and used in Dashboard it is looking like this.
Please some one help me here as I need to deliver the dashboard with in 2 days . I have tried all the possible scenarios I could do still i was not able to get it. Thank you in advance.
I have got a problem with my dashboard which I have been working on. Would be thankful if some one helps me. The lens when clipped and used in the dashboard is not looking like how it is supposed to look. Below are the details.
But when it is clipped and used in Dashboard it is looking like this.
Please some one help me here as I need to deliver the dashboard with in 2 days . I have tried all the possible scenarios I could do still i was not able to get it. Thank you in advance.
Try adjusting your Measure on the lens, as I can see data is there for 'AP Approval' status. But, it's not appearing on the Dashboard due to Measure range.
Thanks for your response. I have verified everything including the Pigql query but still it is showing the same. There are 17 lenses in the dashboard only this alone is bothering us. Any other ideas bro??