


 Apex Code Development
 You need to sign in to do that
Don't have an account?
Einstein Dashboard setting dynamic initial value to a filter
Hi,
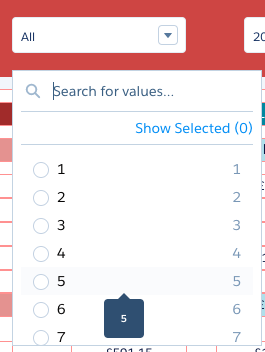
I have a drop-down filter for week numbers, I want to set the current week as selected always when I entered into the dashboard.
I have tried these two blogs, but getting error that widget can not be displayed.
https://help.salesforce.com/articleView?id=bi_dashboard_initial_filters_user_tokens.htm&type=5
https://springml.com/blog/dynamically-setting-initial-filters/
My JSON - I have hard coded for testing, still not working.
{
"broadcastFacet": true,
"groups": [],
"label": "Week_Number__c_1",
"numbers": [],
"query": "q = load \"AllData\";\nq = group q by 'Week_Number__c';\nq = foreach q generate string_to_number('Week_Num__c') as 'week';\nq = order q by 'week' asc;\nq = limit q 200;",
"receiveFacetSource": {
"mode": "include",
"steps": []
},
"selectMode": "single",
"start": 53,
"strings": [],
"type": "saql",
"useGlobal": true,
"visualizationParameters": {
"parameters": {
"autoFitMode": "keepLabels",
"showValues": true,
"bins": {
"breakpoints": {
"high": 100,
"low": 0
},
"bands": {
"high": {
"color": "#008000",
"label": ""
},
"low": {
"color": "#B22222",
"label": ""
},
"medium": {
"color": "#ffa500",
"label": ""
}
}
},
"legend": {
"descOrder": false,
"showHeader": true,
"show": true,
"customSize": "auto",
"position": "right-top",
"inside": false
},
"axisMode": "multi",
"tooltip": {
"showBinLabel": true,
"measures": "",
"showNullValues": true,
"showPercentage": true,
"showDimensions": true,
"showMeasures": true,
"customizeTooltip": false,
"dimensions": ""
},
"visualizationType": "hbar",
"title": {
"fontSize": 14,
"subtitleFontSize": 11,
"label": "",
"align": "center",
"subtitleLabel": ""
},
"binValues": false,
"trellis": {
"flipLabels": false,
"showGridLines": true,
"size": [
100,
100
],
"enable": false,
"type": "x",
"chartsPerLine": 4
},
"showActionMenu": true,
"measureAxis2": {
"sqrtScale": false,
"showTitle": true,
"showAxis": true,
"title": "",
"customDomain": {
"showDomain": false
}
},
"measureAxis1": {
"sqrtScale": false,
"showTitle": true,
"showAxis": true,
"title": "",
"customDomain": {
"showDomain": false
}
},
"theme": "wave",
"dimensionAxis": {
"showTitle": true,
"customSize": "auto",
"showAxis": true,
"title": "",
"icons": {
"useIcons": false,
"iconProps": {
"fit": "cover",
"column": "",
"type": "round"
}
}
},
"applyConditionalFormatting": true
},
"type": "chart"
}
}