


 Apex Code Development
 You need to sign in to do that
Don't have an account?
Einstein Analytics Funnel Chart Unique with Segment Issue
I am facing a issue related to Einstein Analytics Funnel Chart, where I have created a chart on a simple Dataset using one object only and when I use only Segment Size with Unique Id, the total count is coming correct, while when I use Segments also (by a picklist) the unique count becomes wrong.
On observation, I have found that the count after using segment displays unique by considering the unique by combining id along with segment, while my requirement was overall unique id count, can you please help in resolving this issue?
The following image shows correct count of unique ids when Segments is not used -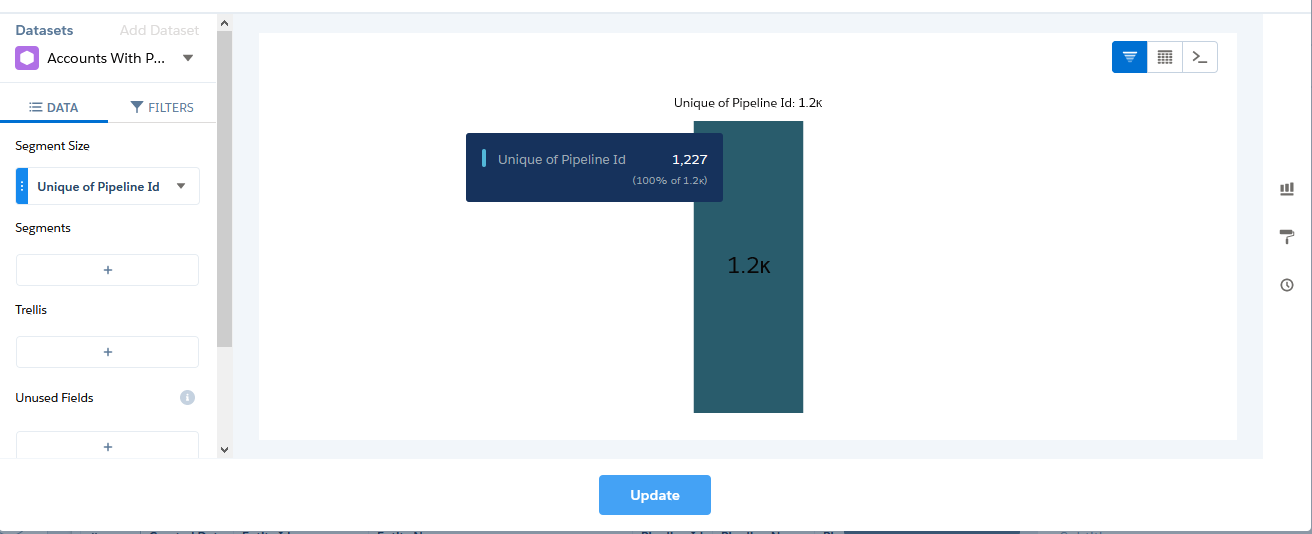
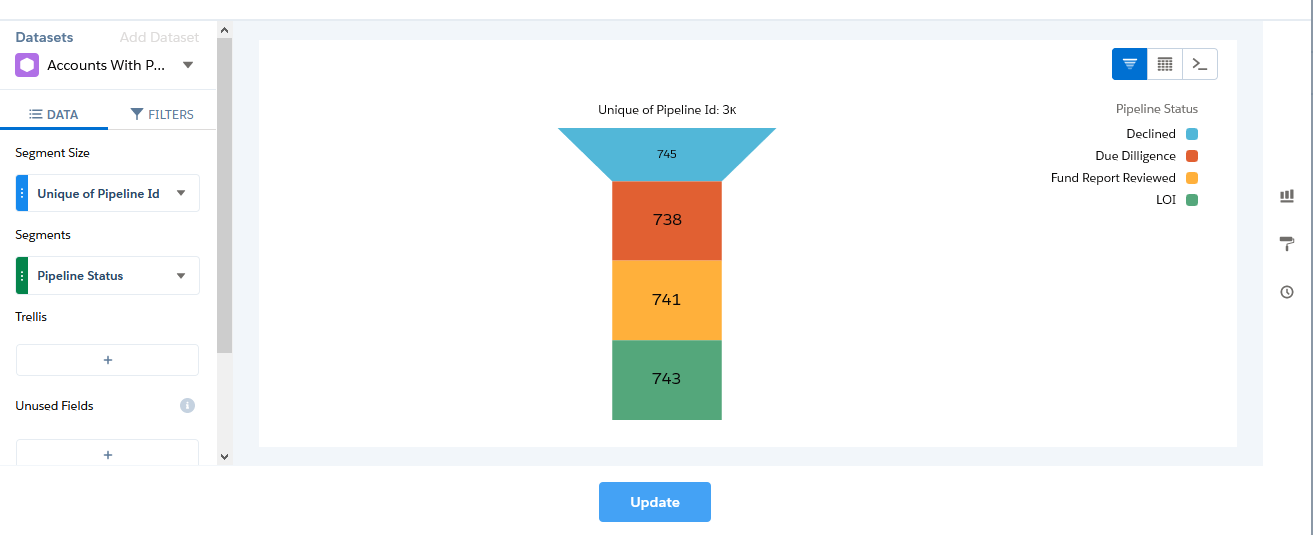
The below image shows incorrect Unqiue count since now Segment has been used -
Please let me know how can I resolve this issue.
Thanks & Regards,
Konica Bhateja
On observation, I have found that the count after using segment displays unique by considering the unique by combining id along with segment, while my requirement was overall unique id count, can you please help in resolving this issue?
The following image shows correct count of unique ids when Segments is not used -
The below image shows incorrect Unqiue count since now Segment has been used -
Please let me know how can I resolve this issue.
Thanks & Regards,
Konica Bhateja
For this graph, I have data in Dataset with repeated Pipeline Id and different Status on different dates, it is more like a log. How can I show only the latest data in this graph keeping in mind there are other graphs also on the page, so I cannot apply Current Month/Quarter filter here, since if I will do so interaction between graphs won't work fine as selecting a criteria on one graph will be added as a filter with AND condition to my existing default condition in this graph. Is it possible?