


 Apex Code Development
 You need to sign in to do that
Don't have an account?
LWC - Debugging with Dev Tools in Chrome
hi all,
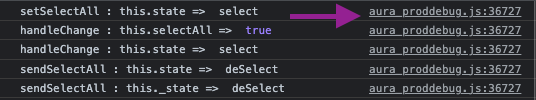
while debugging with Chrome, my console entries all point to aura_proddebug.js.
Bevor they pointed to VM[xxxxx] where xxxxx represents some generic number.
It is very difficult to debug properly under this situation.
would like my console log statements display the names of my LWC js controllers, so I can jump to my file directly in the console.
So any idea why this is happening and what can I do to change this behaviour to the desired behaviour?
Thank You all
When we declare variables such as URL, WINDOW or LOCATION etc in the JavaScript code as a part of your Visualforce pages or as a part of lightning components, it could cause issues with lightning aura framework libraries and other standard Salesforce JavaScript libraries.
I request you to go through this article which will help you with your situation -> https://help.salesforce.com/s/articleView?id=000383886&type=1 (https://help.salesforce.com/s/articleView?id=000383886&type=1)
If it helps please mark this as a Best Answer.
Thank you.