


 Apex Code Development
 You need to sign in to do that
Don't have an account?
Chart Js: How to display data values in each bars chartjs
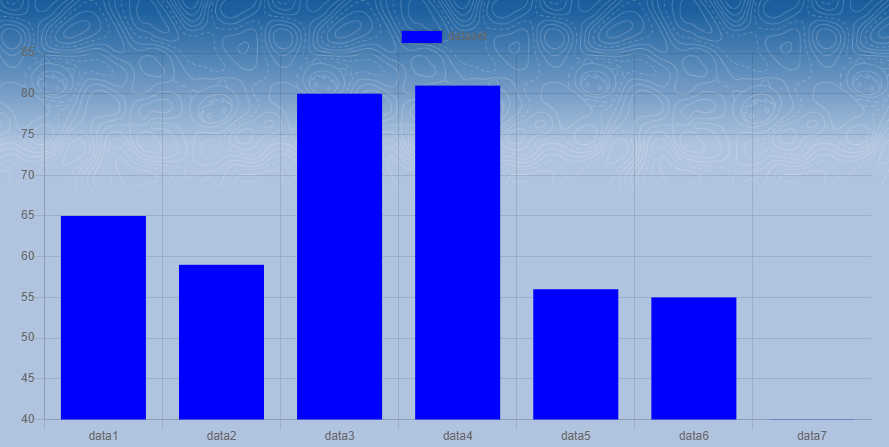
I have built simple bar chart with ChartJS version v2.8.0, so now I am trying to display the data values on each bars using chartjs-plugin-datalabels v1.0.0 (https://github.com/chartjs/chartjs-plugin-datalabels/tags) plugins chartjs-plugin-datalabels I have loaded this plugin as below in the code and registered the plugin as specified in the plugin documentation (https://v1_0_0--chartjs-plugin-datalabels.netlify.app/guide/getting-started.html#registration) but however the data values are not showing up on each bars.
Can anyone point out what am I missing here? that would be helpful
Here is the LwC code:
Can anyone point out what am I missing here? that would be helpful
Here is the LwC code:
import { LightningElement,api, wire, track } from 'lwc';
import chartjs from '@salesforce/resourceUrl/chartjs_v280';
import ChartDataLabels from '@salesforce/resourceUrl/ChartjsPluginDataLabels';
import { loadScript } from 'lightning/platformResourceLoader';

export default class ChartDemocmp extends LightningElement {
    isChartJsInitialized;
    chartConfiguration;

    connectedCallback(){
        this.setData();
    }

    setData(){
        this.chartConfiguration = {
            type: 'bar',
    data: {
     labels: ["data1","data2","data3","data4","data5","data6","data7"],
     datasets: [
      {
       label: 'dataset',
       barPercentage: 0.5,
       barThickness: 6,
       maxBarThickness: 8,
       minBarLength: 2,
       backgroundColor: "blue",
       data: [65, 59, 80, 81, 56, 55, 40],
      },
     ],
    },
    plugins: [ChartDataLabels], //plugin register
    options: {
        resposive:true,
    },
   };
   console.log('chart data---> '+JSON.stringify(this.chartConfiguration));
}


    renderedCallback() {
        /*if (this.isChartJsInitialized) {
            return;
        }*/
        // load chartjs from the static resource
        Promise.all([
            loadScript(this, chartjs)
        ])
        .then(()=>{
            //load ChartDataLabels from the static resource
        Promise.all([
            loadScript(this, ChartDataLabels )
        ])
        .then(() => {
            console.log('Loaded');
            this.isChartJsInitialized = true;

            if(this.chart!= null || this.chart!=undefined){
                this.chart.destroy();//destory the chart once data is updated to show the new chart
                }
        const ctx = this.template.querySelector("canvas.barChart").getContext('2d');
       Chart.plugins.register(ChartDataLabels);
        this.chart = new window.Chart(ctx,JSON.parse(JSON.stringify(this.chartConfiguration)));
        //console.log('data chart');
        });
    })
        .catch(error => {
           console.error('error chart--> '+JSON.stringify(error))

        });

    }


    }
Here is the screen shot of bar chart below where the values are not getting displayed on each bars:
In chart JS data gets shown at two places. first is on Y axis and second is when you hover over each bar , It will show you the data that it is depicting. Same is mentioned in their documentation as well. Please have a look.
https://www.chartjs.org/docs/latest/charts/bar.html
If this helps, Please mark it as best answer.
Thanks!
Thanks for the reply..
But I want to show the data label on each bars without hovers,
I have just followed this link https://salesforce.stackexchange.com/questions/374520/chart-js-in-lwc-display-labels-on-data?rq=1
but some how not able to replicate it
options: {
resposive:true
},
to
options: {
resposive:true,
scales: {
yAxes: [{
ticks: {
beginAtZero: true
}
}]
}
Did you manage to resolve this in the end? I've tried about a million different things nothing seems to work for displaying the labels.