


 Apex Code Development
 You need to sign in to do that
Don't have an account?
Help me! The Graph
the graph Help me
I want to check the transition of last year's data and this year's data on
For example, 1st week of April 2022 and 1st week of April 2023, 2nd week of April 2022 and 2nd week of April 2023, etc.
Is it possible to create two line graphs? Also, is it possible to set the date order regardless of the beginning year?
I want 2022-04-4 and 2021-04-03 to have the same x-axis position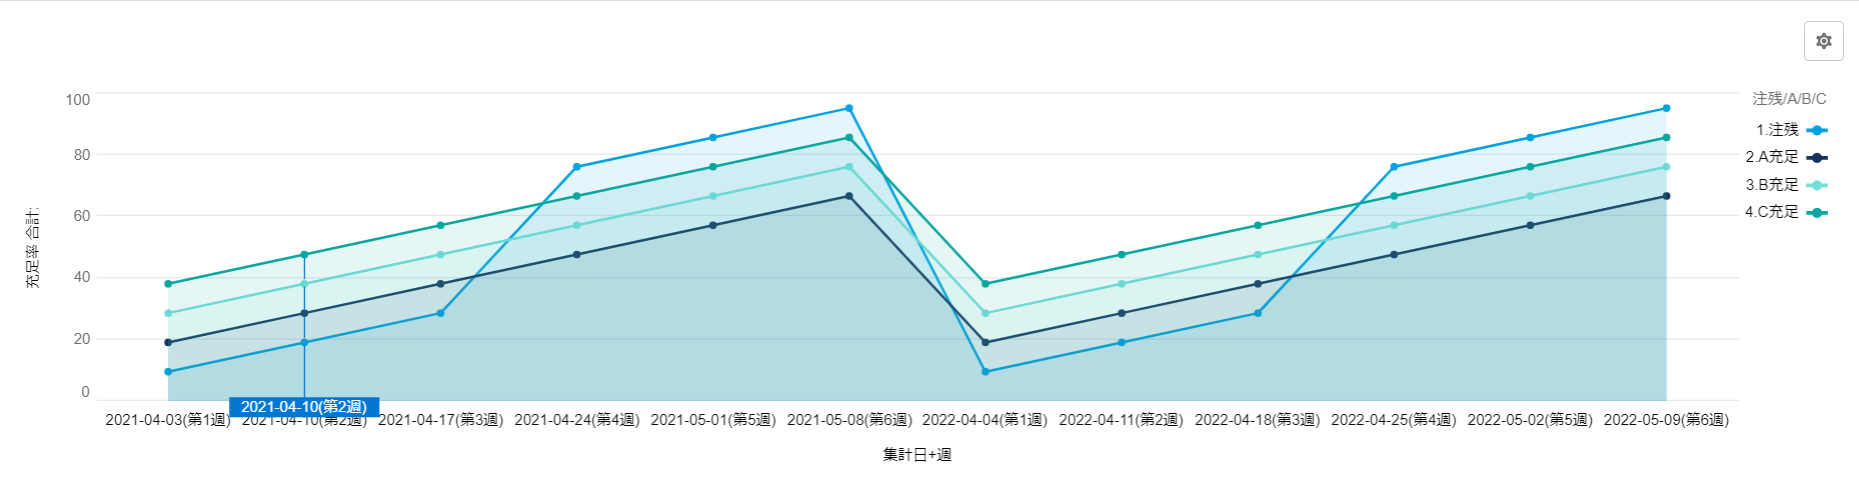
Hi,
Hopefully you can do this with Line Chart Dashboard. I will recommend you to use that and try.
Thank you,
Priya Ranjan