


 Apex Code Development
 You need to sign in to do that
Don't have an account?
Lightning Experience Reports & Dashboards Superbadge - Challenge 7 - R&D Report Modifications
Hi all,
I have attempted to get through Challenge 7 of this superbadge but am getting stuck on the R&D Report Modifications section. I've used a new org for the entire process and initially installed the managed package without issue.
Have reviewed numerous forum posts on various issues with this part of the exercise and am not sure if I'm still setting this up incorrectly or if the test code is not finding a value or component it is looking for.
Trailhead challenge requirement statement:
R&D Report Modifications
The R&D team programmed a SolarBot to beep over to your desk with a note requesting changes to their Temperature to kWh Research report. The overall relationship between temperature and kWh is becoming clear, but they have a theory that each SolarBot model has a different impact on panel efficiency. They want to continue seeing avg kWh and avg panel temperature broken down by temperature range. Additionally, they want to compare average kWh and average panel temperature by SolarBot model on another axis. They also want a graph specific to the report. The graph should show the four temperature range categories from coolest to hottest, again broken down by model, and the average number of kilowatt hours. Place categories on the X axis, with count on the Y axis. After you finish your work on the report, the SolarBot gives some chipper chirps and returns to R&D. Good bot.
Report Title: Temperature to kWh Research
Type: SolarBots and Status Data
Folder Location: Reports > SolarBot R&D Reports
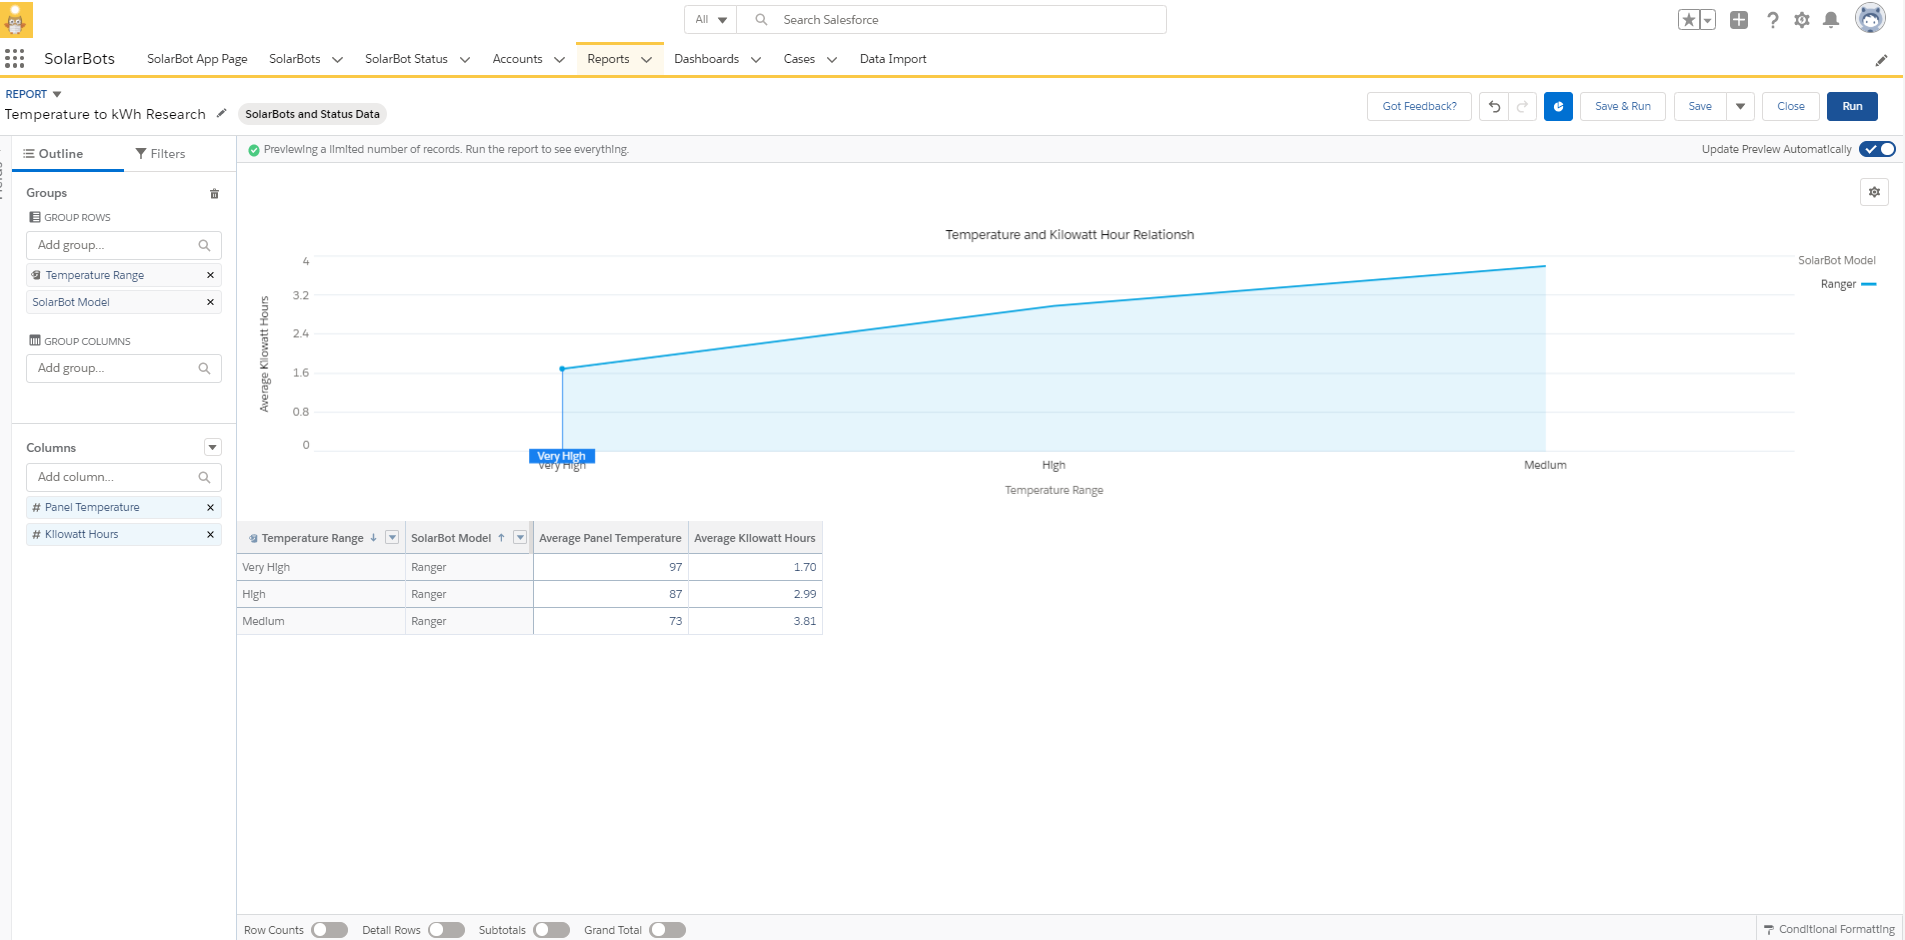
On the left under Outline I have:
Temperature Range
SolarBot Model
Temperature Range is bucketed to:
<=65 Low
>65 to 80 Medium
>80 to 95 High
> 95 Very High
Under Columns I have:
Panel Temperature, summarized as Average
Kilowatt Hours, summarized as Average
At the bottom of th page I have all sliders set in the off position.
For my chart:
Type: Line
Chart Title: Temperature and Kilowatt Hour Relationsh
The title Temperature and Kilowatt Hour Relationship is too long for the title box
X-Axis: Temperature Range and SolarBot Model
Y-Axis: Average Kilowatt Hours
Saved and ran it.
When I click Check Challenge on the page for step 6 I get:
Challenge Not yet complete... here's what's wrong:
We can’t find the additional analysis by model being performed on the 'Temperature to kWh Research' report. Remember that you can organize data horizontally and vertically at the same time.

Can someone point out what is not meeting the requirement here, please?
I have attempted to get through Challenge 7 of this superbadge but am getting stuck on the R&D Report Modifications section. I've used a new org for the entire process and initially installed the managed package without issue.
Have reviewed numerous forum posts on various issues with this part of the exercise and am not sure if I'm still setting this up incorrectly or if the test code is not finding a value or component it is looking for.
Trailhead challenge requirement statement:
R&D Report Modifications
The R&D team programmed a SolarBot to beep over to your desk with a note requesting changes to their Temperature to kWh Research report. The overall relationship between temperature and kWh is becoming clear, but they have a theory that each SolarBot model has a different impact on panel efficiency. They want to continue seeing avg kWh and avg panel temperature broken down by temperature range. Additionally, they want to compare average kWh and average panel temperature by SolarBot model on another axis. They also want a graph specific to the report. The graph should show the four temperature range categories from coolest to hottest, again broken down by model, and the average number of kilowatt hours. Place categories on the X axis, with count on the Y axis. After you finish your work on the report, the SolarBot gives some chipper chirps and returns to R&D. Good bot.
Report Title: Temperature to kWh Research
Type: SolarBots and Status Data
Folder Location: Reports > SolarBot R&D Reports
On the left under Outline I have:
Temperature Range
SolarBot Model
Temperature Range is bucketed to:
<=65 Low
>65 to 80 Medium
>80 to 95 High
> 95 Very High
Under Columns I have:
Panel Temperature, summarized as Average
Kilowatt Hours, summarized as Average
At the bottom of th page I have all sliders set in the off position.
For my chart:
Type: Line
Chart Title: Temperature and Kilowatt Hour Relationsh
The title Temperature and Kilowatt Hour Relationship is too long for the title box
X-Axis: Temperature Range and SolarBot Model
Y-Axis: Average Kilowatt Hours
Saved and ran it.
When I click Check Challenge on the page for step 6 I get:
Challenge Not yet complete... here's what's wrong:
We can’t find the additional analysis by model being performed on the 'Temperature to kWh Research' report. Remember that you can organize data horizontally and vertically at the same time.
Can someone point out what is not meeting the requirement here, please?
For all the Trailhead issues please report it here,
https://trailhead.salesforce.com/en/help?support=home
So that our trailhead support engineers will look into it and get back to you.
Kindly let me know if it helps you and close your query by marking it as solved so that it can help others in the future. It will help to keep this community clean.
Regards,
Salesforce Support.
Group rows by Temperature Range
Group columns by SolarBot Model
Chart type: vertical column
X-Axis: Temperature Range grouped with SolarBot Model
Y-axis: Average Kilowatt Hours
Clicked Save & Run
Ran check challenge and it passed looking like this:
Configuration: