You need to sign in to do that
Don't have an account?
values of chart in visualforce page
hi! how can i group records shown in custom chart?
i created a custom chart in visalforce page.
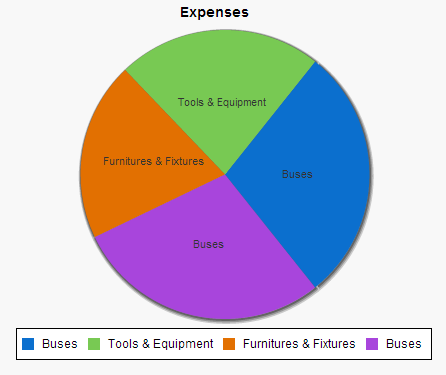
it looks like this:


APEX CLASS:
i created a custom chart in visalforce page.
it looks like this:
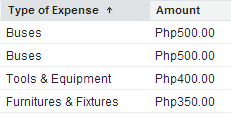
this is from the list of records in Expense__c object
i need the pie chart to show the largest part for Buses=P1000
how can i group these records?
here is my code:
VF:
how can i group these records?
here is my code:
VF:
<apex:page controller="ChartsCC" title="Pie Chart">
<apex:chart height="350" width="450" data="{!pieData}">
<apex:pieSeries dataField="data" labelField="name"/>
<apex:legend position="bottom"/>
</apex:chart>
</apex:page>
<apex:chart height="350" width="450" data="{!pieData}">
<apex:pieSeries dataField="data" labelField="name"/>
<apex:legend position="bottom"/>
</apex:chart>
</apex:page>
APEX CLASS:
public with sharing class ChartsCC {
public List<PieChartData> getPieData() {
List<PieChartData> data = new List<PieChartData>();
for (Expense__c exp : [SELECT Type_of_Expense__c FROM Expense__c]) {
data.add(new PieChartData(exp.Type_of_Expense__c, 20));
}
return data;
}
public class PieChartData {
public String name { get; set; }
public Decimal data { get; set; }
public PieChartData(String name, Decimal data) {
this.name = name;
this.data = data;
}
}
}


 Apex Code Development
the below code works.
--------------
public with sharing class ChartsCC {
public List<PieChartData> getPieData() {
List<PieChartData> data = new List<PieChartData>();
AggregateResult[] groupedResults = [SELECT Type_of_Expense__c ,Sum(Expenses__c) FROM Expense__c Group by Type_of_Expense__c];
for (AggregateResult ar : groupedResults) {
if(ar.get('Type_of_Expense__c')!=null)
{
data.add(new PieChartData(
String.ValueOf(ar.get('Type_of_Expense__c')),
Double.ValueOf(ar.get('expr0'))
));
}
}
return data;
}
public class PieChartData {
public String name { get; set; }
public Decimal data { get; set; }
public PieChartData(String name, Decimal data) {
this.name = name;
this.data = data;
}
}
}
---------------------
<apex:page controller="ChartsCC" title="Pie Chart">
<apex:chart height="350" width="450" data="{!pieData}">
<apex:pieSeries dataField="data" labelField="name"/>
<apex:legend position="bottom"/>
</apex:chart>
</apex:page>
---------
Hope this helps!
----------------------------------
J G
All Answers
the below code works.
--------------
public with sharing class ChartsCC {
public List<PieChartData> getPieData() {
List<PieChartData> data = new List<PieChartData>();
AggregateResult[] groupedResults = [SELECT Type_of_Expense__c ,Sum(Expenses__c) FROM Expense__c Group by Type_of_Expense__c];
for (AggregateResult ar : groupedResults) {
if(ar.get('Type_of_Expense__c')!=null)
{
data.add(new PieChartData(
String.ValueOf(ar.get('Type_of_Expense__c')),
Double.ValueOf(ar.get('expr0'))
));
}
}
return data;
}
public class PieChartData {
public String name { get; set; }
public Decimal data { get; set; }
public PieChartData(String name, Decimal data) {
this.name = name;
this.data = data;
}
}
}
---------------------
<apex:page controller="ChartsCC" title="Pie Chart">
<apex:chart height="350" width="450" data="{!pieData}">
<apex:pieSeries dataField="data" labelField="name"/>
<apex:legend position="bottom"/>
</apex:chart>
</apex:page>
---------
Hope this helps!
----------------------------------
J G
thank you J G! it works! :)
how about if i'm going to create a line graph? i tried this for a new line graph but noithing shows:
VF:
<apex:chart height="310" width="450" data="{!LineGraphData}">
<apex:axis type="Numeric" position="left" fields="resNum" title="# of Reservations" grid="true"/>
<apex:axis type="Category" position="bottom" fields="months" title="Month of the Year"/>
<apex:lineSeries axis="left" xField="months" yField="resNum" markerType="cross" markerSize="4" markerFill="#FF0000"/>
</apex:chart>
APEX CLASS:
public List<LineData> getLineGraphData() {
Date currentDate = system.Today();
Integer currentYear = currentDate.year();
List<LineData> ldata = new List<LineData>();
AggregateResult[] groupedResults = [SELECT FISCAL_MONTH(CreatedDate),COUNT(Name) FROM Reservation__c where CALENDAR_YEAR(CreatedDate)=:currentYear Group by FISCAL_MONTH(CreatedDate)];
for (AggregateResult ar : groupedResults) {
ldata.add(new LineData(
String.ValueOf(ar.get('FISCAL_MONTH(CreatedDate)')),
Double.ValueOf(ar.get('expr0'))
));
}
return ldata;
}
public class LineData {
public String months { get; set; }
public Decimal resNum { get; set; }
public LineData(String months, Decimal resNum) {
this.months = months;
this.resNum = resNum;
}
}
thanks again :)
ldata.add(new LineData(
String.ValueOf(ar.get('expr0')),
Double.ValueOf(ar.get('expr1'))
));
}