


 Apex Code Development
 You need to sign in to do that
Don't have an account?
Help for Reporting
My requirement is to create a dashboard bar graph X-axis as createddate(MONTHLY) and the y-AXIS (RECORD COUNT)
In the first image i had Groupby N EP/DPI: and write formula as ROWCOUNT/ROWCOUNT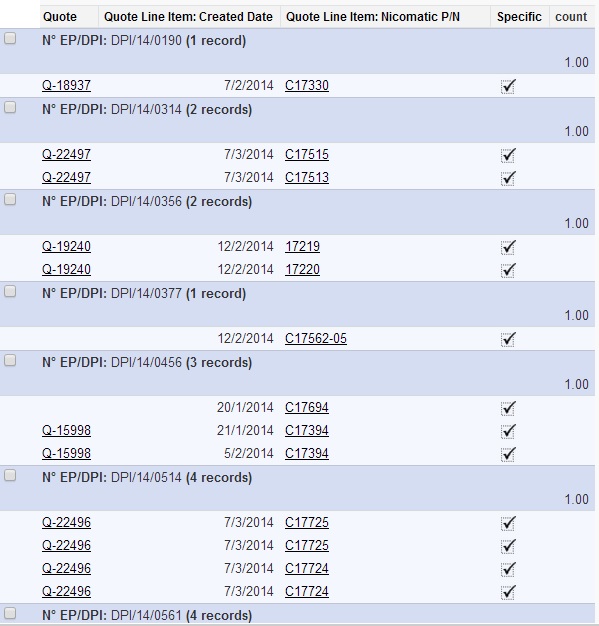
IN the second Image i had kept the GROUP BY CREATEDDATE/MONTH ?
How can can i write the formula so that i can get the formula as get count 2
not as 3 .how many N EPDPI as there that i need the that count
DASHBOARD: DEC-2013(2 records) x y axis
This is my criteria Hope.it is so confusing Reply me if you don't understand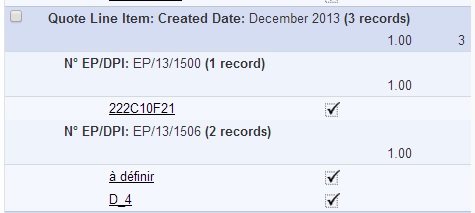
See the below links they have similar discussion and solution for this issue,
https://success.salesforce.com/answers?id=90630000000h2N0AAI
http://salesforce.stackexchange.com/questions/1213/need-count-of-unique-field-values-by-month
Regards,
Ashish