


 Apex Code Development
 You need to sign in to do that
Don't have an account?
Action support rerender
Following is what i´ m trying to accomplish:
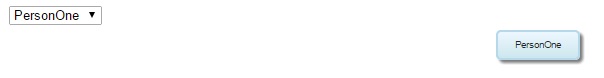
and on change picklist:
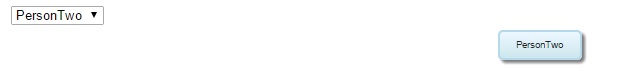
Switching between picklist values should update the Person in the chart: I got this working with following code:
VF Component:
Controller:
There is only one problem: on change picklist value all the page is refreshed (picklist+ chart). Instead,on change person, i would like to refresh only the chart and not the whole page.
I´ ve tried adding rerender attribute to actionSupport tag:
Do you know how can i refresh only the chart and not the whole page?
Thanks in advance for any advice.
and on change picklist:
Switching between picklist values should update the Person in the chart: I got this working with following code:
VF Component:
<apex:component Controller="ForecastHierarchyController">
    <apex:includeScript value="https://www.google.com/jsapi"/>
    <script>
        google.load('visualization', '1', {packages:['orgchart']});
        google.setOnLoadCallback(drawChart);

        function drawChart() {
            var data = new google.visualization.DataTable();
            data.addColumn('string', 'Name');
            data.addColumn('string', 'Parents');
            data.addColumn('string', 'Type');
            data.addRows([
                // All data rows are calculated in Apex controller
                // and returned as a string with line endings CR+LF
                {!accRows}
            ]);

            var chart = new google.visualization.OrgChart(document.getElementById('chart_div'));


            chart.draw(data, {allowHtml:true,
                              size:'medium',
                              allowCollapse:true});

        }
    </script>


     <apex:form >
        <apex:selectList value="{!FilterType}" multiselect="false" size="1">
              <apex:selectOption itemLabel="PersonOne" itemvalue="PersonOne"/>
               <apex:selectOption itemLabel="PersonTwo" itemvalue="PersonTwo"/>
               <apex:actionSupport event="onchange" action="{!CreateChartData}" onsubmit="drawChart();"/>
        </apex:selectList>
	 </apex:form>

	 <apex:outputPanel id="chart">
	    <div id='chart_div'>
		</div>
     </apex:outputPanel>
</apex:component>
Controller:
public class ForecastHierarchyController {
	private account acc;
	public String FilterType {get;set;}
	public String accRows {get;set;}

    public ForecastHierarchyController() {
    	FilterType='PersonOne';
    	CreateChartData();
    }

    public void CreateChartData(){
        system.debug('####FilterType'+FilterType);
     	accRows= '';
     	if (FilterType=='PersonOne'){
	        accRows+=            '[{v:\''    + 'PersonOne'+
		                         '\', f:\''  + 'PersonOne' +
		                         '\'},\''    + '' +
		                         '\',\''     + '' +
		                         '\'],\r\n';
     	}
     	else{
	        accRows+=            '[{v:\''    + 'PersonTwo'+
		                         '\', f:\''  + 'PersonTwo' +
		                         '\'},\''    + '' +
		                         '\',\''     + '' +
		                         '\'],\r\n';
     	}

     	accRows+= '[\'\',\'\',\'\']';
     	system.debug('accRows'+accRows);
    }


}
There is only one problem: on change picklist value all the page is refreshed (picklist+ chart). Instead,on change person, i would like to refresh only the chart and not the whole page.
I´ ve tried adding rerender attribute to actionSupport tag:
<apex:actionSupport event="onchange" action="{!CreateChartData}" onsubmit="drawChart();" rerender="chart" />
but it doesn´t work,on change picklist value chart isn´t showed anymore.Do you know how can i refresh only the chart and not the whole page?
Thanks in advance for any advice.
<apex:component Controller="ForecastHierarchyController">
    <apex:includeScript value="https://www.google.com/jsapi"/>
  <apex:outputPanel id="script">
    <script>
        google.load('visualization', '1', {packages:['orgchart']});
        google.setOnLoadCallback(drawChart);

        function drawChart() {
            var data = new google.visualization.DataTable();
            data.addColumn('string', 'Name');
            data.addColumn('string', 'Parents');
            data.addColumn('string', 'Type');
            data.addRows([
                // All data rows are calculated in Apex controller
                // and returned as a string with line endings CR+LF
                {!accRows}
            ]);

            var chart = new google.visualization.OrgChart(document.getElementById('chart_div'));


            chart.draw(data, {allowHtml:true,
                              size:'medium',
                              allowCollapse:true});

        }
    </script>
   </apex:outputPanel>

     <apex:form >
        <apex:selectList value="{!FilterType}" multiselect="false" size="1">
              <apex:selectOption itemLabel="PersonOne" itemvalue="PersonOne"/>
              <apex:selectOption itemLabel="PersonTwo" itemvalue="PersonTwo"/>
              <apex:actionSupport event="onchange" action="{!CreateChartData}" oncomplete="drawChart();" rerender="script" />
        </apex:selectList>
	 </apex:form>

	 <apex:outputPanel id="chart">
	    <div id='chart_div'>
		</div>
     </apex:outputPanel>
</apex:component>