You need to sign in to do that
Don't have an account?
Vf page for Dashboard.
Hi,
I need help on creating a cumulative dashboard. My requirement was to create a Dashboard that shows the Record Count(y-axis) vs Account Name(x-axis), however I would like to set the Record Count as cumulative, and plot an additional line which is Target. Target is a Summary Formula on reports, this is a workaround to get Target line.
If suppose I have 3 Accounts: Account1, Account2, Account3 and I have the Placements created for these Accounts as below:
Account1- 1 Placement Record
Account2- 1 Placement Record
Account3- 2 Placement Records
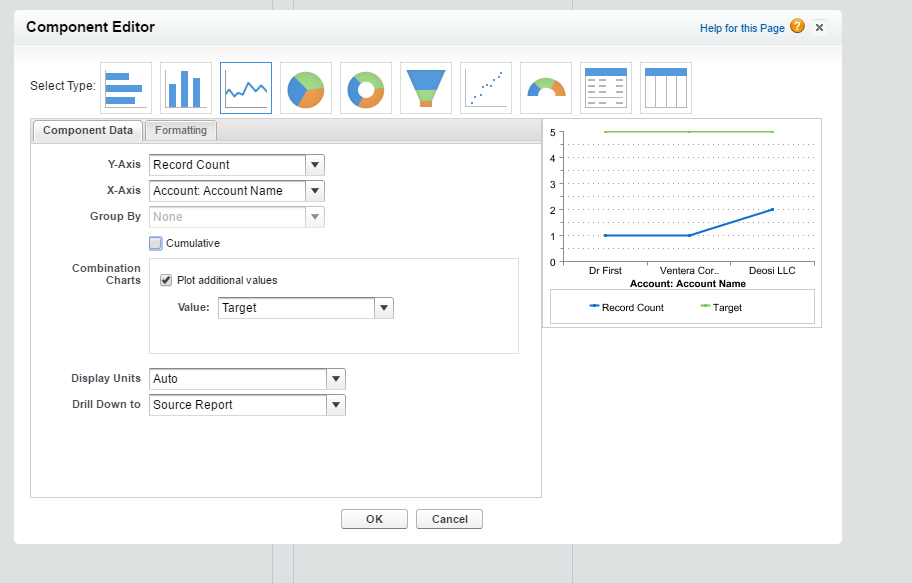
My dashboard shows the Data like this when I dont check Cumulative:
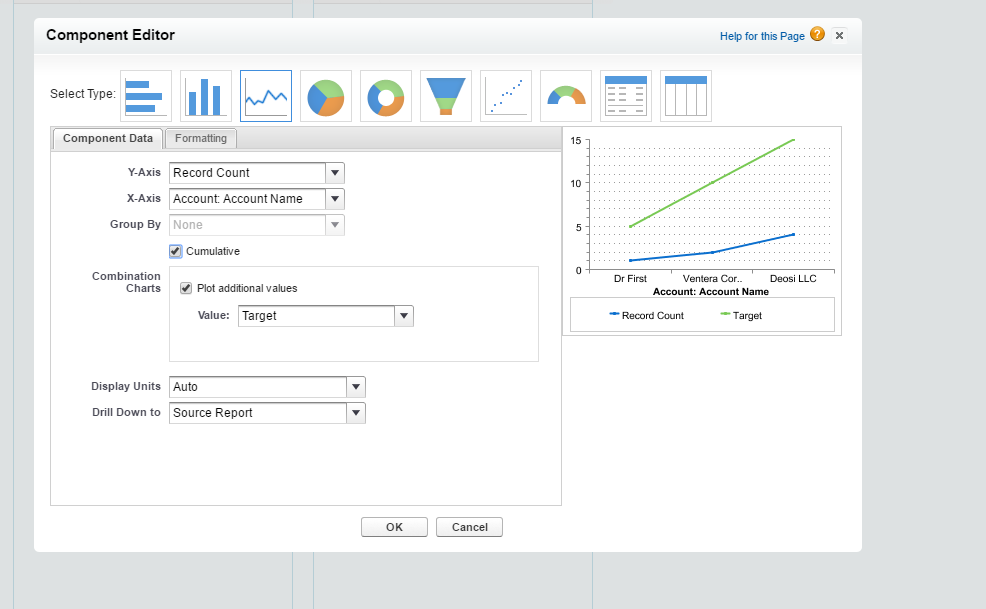
When I check the Cumulative, Record Count and the Target line both are Cumulated which is not the way I wanted.

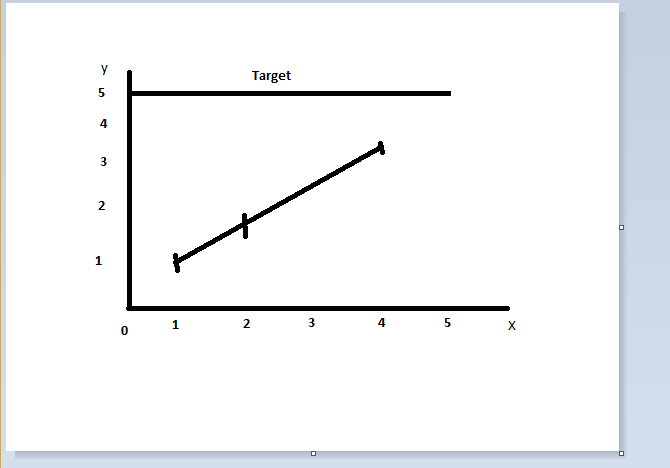
I want it to be the way below:

I had a discussion with Salesforce Technical support team and even they confirmed that we can not achieve this through standard functionality.
Any help or suggestion on this is much Appreciated.
Thanks,
Jancy Mary
I need help on creating a cumulative dashboard. My requirement was to create a Dashboard that shows the Record Count(y-axis) vs Account Name(x-axis), however I would like to set the Record Count as cumulative, and plot an additional line which is Target. Target is a Summary Formula on reports, this is a workaround to get Target line.
If suppose I have 3 Accounts: Account1, Account2, Account3 and I have the Placements created for these Accounts as below:
Account1- 1 Placement Record
Account2- 1 Placement Record
Account3- 2 Placement Records
My dashboard shows the Data like this when I dont check Cumulative:
When I check the Cumulative, Record Count and the Target line both are Cumulated which is not the way I wanted.
I want it to be the way below:
I had a discussion with Salesforce Technical support team and even they confirmed that we can not achieve this through standard functionality.
Any help or suggestion on this is much Appreciated.
Thanks,
Jancy Mary


 Apex Code Development