


 Apex Code Development
 You need to sign in to do that
Don't have an account?
Create sales dashboards in Salesforce Classic - Superbadge
I am getting the following error:
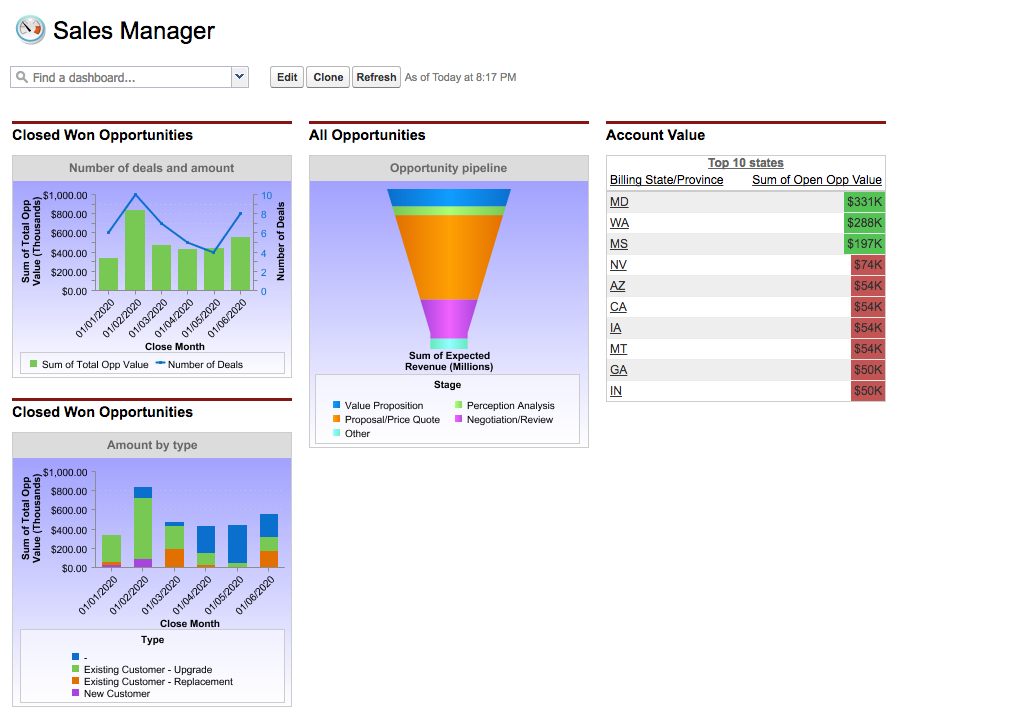
The 'Sales Manager' dashboard does not have the correct headers and titles for the chart components.
Here is the screenshot of my dashboard
The 'Sales Manager' dashboard does not have the correct headers and titles for the chart components.
Here is the screenshot of my dashboard
All Answers
Same question is here in community you can refer this
https://developer.salesforce.com/forums/?id=906F0000000kDMbIAM
Best Regards,
Amit Ghadage
I have the source reports properly named with the exception of "Opportunity Pipeline". I had deleted that original report after a check I did earlier, and now I cannot create the same report name even though I deleted it and emptied the recycle bin. It's called Opportunity Pipeline4 now.
I certainly hope this isnt the issue - that would be a shame.
Still not able to pass the test
At first glance your opportunity pipeline looks to be summarized by the wrong field. It should be stage, not type.
- Is your Dashboard named correctly "Sales Rep" or "Sales Manager"
- My Y axes on report number of deals and amount is Sum of Total Opp and Number of Deals. Yours say "Sum of Amount" and "Record Count"
- Your reports bring in data outside the defined range of 1/1/2020 - 6/30-2020
Looking deeper, I suspect my final problem is the "Close date" for the Closed Won Opportunities charts. The example in the requirements shows "Close date" with a month/1/year. But Close Date is what shows as a field for the reports and can be grouped that way, but reflects the month spelled out. Using "Close Month" works, but then shows as "Month" instead of "date". Any hints to get the grouping as defined?
Challenge Not yet complete... here's what's wrong:
The 'Sales Manager' dashboard does not have the correct headers and titles for the chart components.
Jay, I have definitely done many refreshes before checking. The symbols are because I used the Edit screen for the screenshot so that I could show Source.
Really wish they had someone monitoring these threads to tell us more specific reasons. The reason it provides just isn't accurate.
Create a Total Opp Value field on the Account object to summarize the value of all closed won opportunities for the account.
Create an Open Opp Value field on the Account object to summarize the value of all open opportunities for the account. In the report, this field is grouped into three categories; call the resulting categorized field Account Value:
I'll try creating a new thread, but to have a "Superbadge" with no support from Salesforce is quite disappointing.
Thanx for your help/trying.
https://developer.salesforce.com/forums?communityId=09aF00000004HMGIA2#!/feedtype=SINGLE_QUESTION_DETAIL&dc=Developer_Forums&criteria=OPENQUESTIONS&id=906F0000000kHGIIA2
Thanks
Yeah I checked Use Chart from Report . The same error frustated me . I did second time again all the headers and title (Copy , Paste from Trailhead ) it did passed me that challenge.
How to get Closed Won Opportunities,All Opportunities,account value on dashboard.cant find it in data sources
The 'Sales Manager' dashboard does not have the correct headers and titles for the chart components.
Was that I modified the unique names of some reports: example: I put Contacts_Without_Hobbies2, so I corrected that ones and I passed the challenge.
Maybe this is a basic question but do you know if source reports needs to be created I couldn't fin in any place the Closed Opps: number and amount by month.
Let me know your comments.
Thanks
Hii All..
Stucked on challenge 2 Unable to proceed getting this error...
here are my screenshots for the sales and marketing manager dashboard
I've been spending a while before getting out of here.
All my titles and labels were ok but since I'm french, I typed a space after the ':' sign in the report named Closed Opps: number and amount by month.
After building the same report, saved with the correct name, I passed the challenge. So be aware that report's names are checked too.
My two cents.
I get the following error "The Sales Manager 'Amount by type' component does not have either the correct chart type or report source"
Verified a number of times that the source name is corrected (created by cut/paste from the challenge)
Here is how the "Account by type" chart looks like, anyone face similar problem or perhaps I am still missing something?
Any pointers apprecicated.
It seems like your graph is not stacked. Be sure to have the side-by-side display selected.
Regards
@Brian Christiansen...Thank you... Your Picture helped me a lot to Tally my headers with yours...!!
After a long time and tremendous changes I passed the 2nd Challenge otherwise, I was continuously getting the same error that the headers and title are incorrect.
Note All those who will attempt this Challenge do remember that just clone the "Sales manager" Dashboards for the "Sales Reps" Dashboards.
Here is My finalized Dashboards Images:
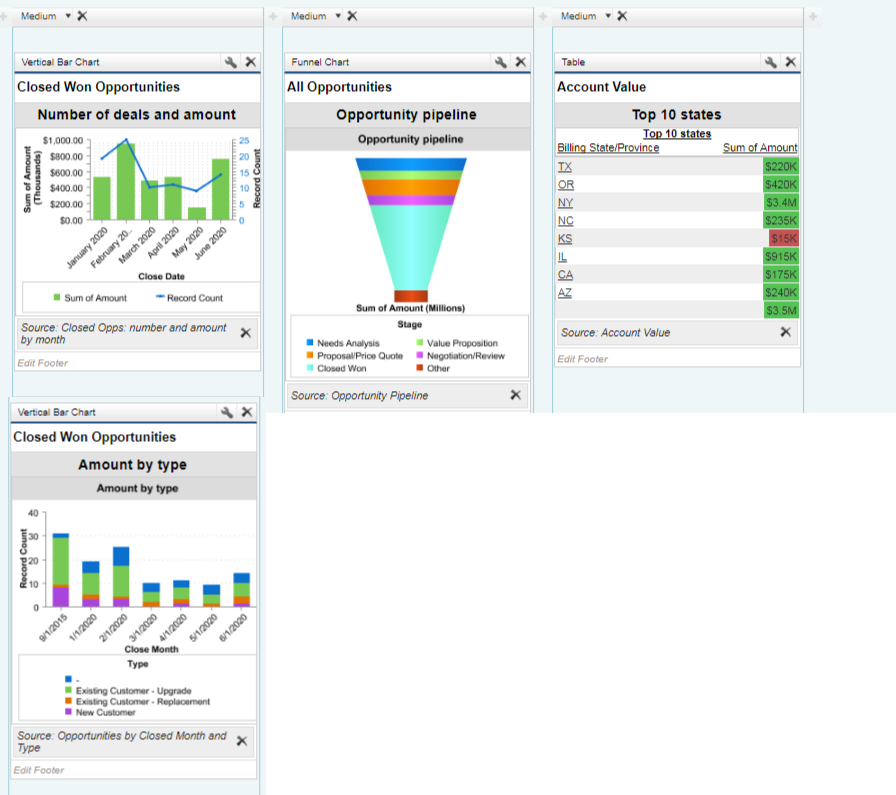
Sales Manager:
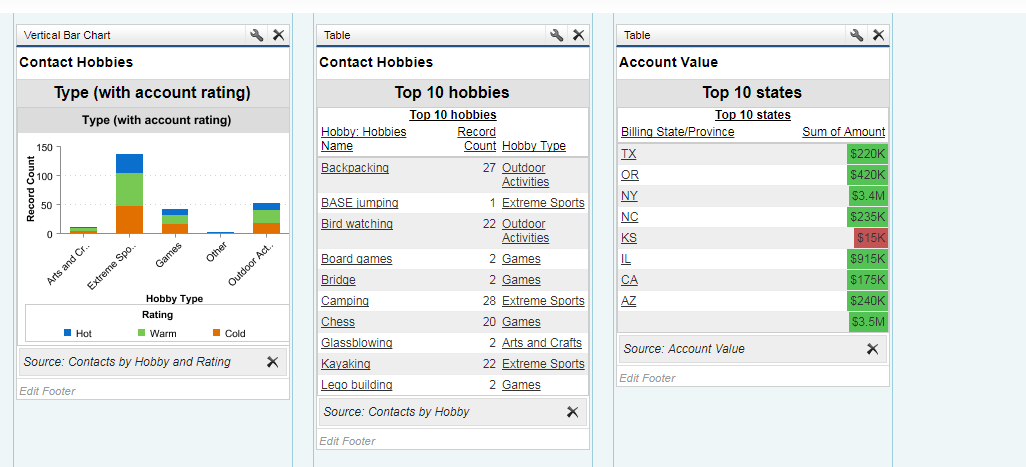
Marketing Manager:
Regards,
Rohan Saraf