


 Apex Code Development
 You need to sign in to do that
Don't have an account?
Superbadge - Rpt & Dashboards - Challenge 2 error
All, I'm receiving the below error when trying this challenge.
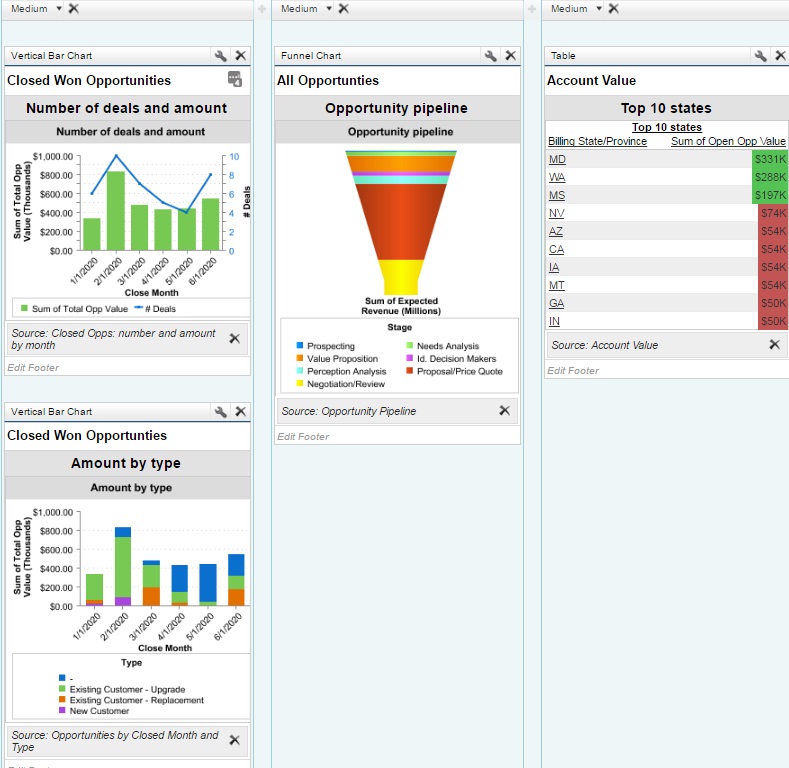
The 'Sales Manager' dashboard does not have the correct headers and titles for the chart components.
I've tried many things including changing the base field for the Summary to the OOB fields, but it doesn't help. My configurations are shown below and seem to match the requirements as exactly as I can find. Does anyone else have any suggestions? Can't find a Salesforce help for the Superbadges.
I've also taken a screen shot of the dashboard I created, which looks like Bob's.
I've browsed several forumn discussions and I don't feel any closer to solving this problem.
1) I edited the source reports for both Closed Won Opportunities charts to no longer use the close date field. I replaced it with the close month field.
2) I edited the source report for Account Value to use Sum of Open Opp Value field instead of Amount field--the reason I'd used the Amount field to begin with is the sketch included with the instructions clearly uses the "Amount" field.
On to the next one for me.
I am trying to create a dashboard with Title “Number of deals and amount”. I got the below combination chart with all the required details but the only problem is how do I get “# of deals” label. Currently it shows record count on the Y axis at right hand side where as it should be” Number of Deals” as per the trailhead requirement.
Now record count is nothing but number of closed won opportunities which are equal to number of deals. I am not sure if I am missing any step or is there any way to change the labels on Y axis.
Any help is really appreciated
Thanks,
Rajesh
Did you figure out how its done ? I have the same issue.
I have meticulously copy-pasted all the reports name. Still facing the same issue. Not sure what is going wrong.
Thanks in advance.
I have created the report exactly like it is mentioned in the challenge , still it shows the error :Challenge Not yet complete... here's what's wrong:
The 'Sales Manager' dashboard does not have the correct headers and titles for the chart components.
I have looked through multiple solution already posted, but still not able to complete the challenge.
One thing I notice is that your source report for "Number of deals and amount" should be "Closed Opps: number and amount by month" (and not "Closed Opps: number of deals and amount"). In my case, the chart I have is a simple vertical bar chart whereas yours looks like it is stacked. I'm not sure if that has anything to do with it, but you could try to update that component....
Lisa
However, when I changed the stacked vertical bar chart to a normal bar chart, the step 2 finally passed. I was accidentally grouping by "type" too. Thank you so much! I was getting very frustrated with this. On to the next challenge!